## Line Graphs: Accuracy vs. Number of CoT Steps Across Tasks
### Overview
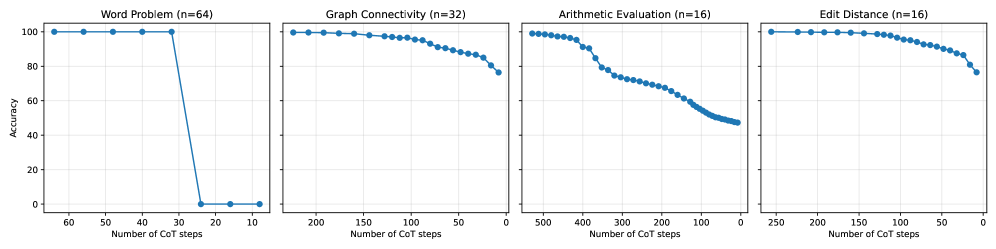
The image contains four line graphs comparing the accuracy of a model across different tasks as a function of the number of Chain-of-Thought (CoT) steps. Each graph represents a distinct task with varying sample sizes (n=64, 32, 16, 16). The y-axis measures accuracy (0–100%), and the x-axis measures the number of CoT steps. All graphs show a general decline in accuracy with increasing CoT steps, though the rate and pattern of decline differ by task.
---
### Components/Axes
1. **X-Axis**: "Number of CoT steps" (ranges from 0 to 60, 200, 500, and 250 for the respective tasks).
2. **Y-Axis**: "Accuracy" (0–100%).
3. **Legends**: Not explicitly visible; data series are differentiated by line styles (solid blue lines with markers).
4. **Task Labels**:
- Word Problem (n=64)
- Graph Connectivity (n=32)
- Arithmetic Evaluation (n=16)
- Edit Distance (n=16)
---
### Detailed Analysis
#### 1. **Word Problem (n=64)**
- **Trend**: Accuracy remains at 100% for the first 30 CoT steps, then drops sharply to near 0% by 40 steps.
- **Key Data Points**:
- 0–30 steps: 100% accuracy.
- 30–40 steps: Plummets from 100% to ~2%.
- 40+ steps: Remains near 0%.
#### 2. **Graph Connectivity (n=32)**
- **Trend**: Gradual decline from ~100% at 0 steps to ~75% at 200 steps.
- **Key Data Points**:
- 0–50 steps: ~95–100% accuracy.
- 50–150 steps: ~85–95% accuracy.
- 150–200 steps: ~75–85% accuracy.
#### 3. **Arithmetic Evaluation (n=16)**
- **Trend**: Steeper decline than Graph Connectivity, dropping from ~100% at 0 steps to ~50% at 200 steps.
- **Key Data Points**:
- 0–100 steps: ~90–100% accuracy.
- 100–200 steps: ~60–80% accuracy.
- 200+ steps: ~50% accuracy.
#### 4. **Edit Distance (n=16)**
- **Trend**: Moderate decline from ~100% at 0 steps to ~75% at 250 steps.
- **Key Data Points**:
- 0–100 steps: ~95–100% accuracy.
- 100–200 steps: ~85–95% accuracy.
- 200–250 steps: ~75–85% accuracy.
---
### Key Observations
1. **Threshold Effect in Word Problem**: Accuracy collapses abruptly after 30 steps, suggesting a critical threshold where the model fails to generalize beyond a certain complexity.
2. **Sample Size Correlation**: Larger sample sizes (n=64) correlate with higher initial accuracy but sharper declines, while smaller samples (n=16) show more gradual degradation.
3. **Task Complexity**: Arithmetic Evaluation and Edit Distance exhibit slower declines, implying these tasks may be more robust to incremental CoT steps.
4. **Consistency in Decline**: All tasks show reduced accuracy with more steps, indicating diminishing returns or overfitting to simpler reasoning paths.
---
### Interpretation
The data suggests that Chain-of-Thought reasoning performance is highly sensitive to task complexity and sample size. The abrupt drop in Word Problem accuracy implies a potential "reasoning horizon" where the model cannot extend beyond a certain number of steps. Smaller sample sizes (n=16) may reflect tasks with less variability, allowing the model to maintain higher accuracy longer but failing catastrophically when pushed beyond its training distribution. The gradual declines in Graph Connectivity and Edit Distance highlight task-specific trade-offs between reasoning depth and accuracy. These findings underscore the need for adaptive CoT step limits tailored to task difficulty and dataset characteristics.