## Diagram: Node-Based System Architecture
### Overview
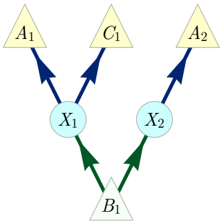
The diagram illustrates a node-based system with directional relationships between components. It features six labeled nodes (A1, C1, A2, X1, X2, B1) connected by colored arrows (blue and green). The structure suggests a flow of information or processes from input nodes to intermediate nodes and finally to an output node.
### Components/Axes
- **Nodes**:
- **A1, C1, A2**: Positioned at the top, likely representing input or source components.
- **X1, X2**: Intermediate nodes in the middle layer.
- **B1**: Final output node at the bottom.
- **Arrows**:
- **Blue arrows**: Connect A1 → X1, C1 → X1, and X2 → A2.
- **Green arrows**: Connect X1 → B1 and X2 → B1.
- **Color Coding**:
- Blue arrows may represent primary input pathways.
- Green arrows may represent final processing or output pathways.
### Detailed Analysis
1. **Input Nodes (A1, C1, A2)**:
- A1 and C1 both connect to X1 via blue arrows, suggesting they contribute to the same intermediate process (X1).
- A2 connects to X2 via a blue arrow, indicating a separate input pathway for X2.
2. **Intermediate Nodes (X1, X2)**:
- X1 receives inputs from A1 and C1, then outputs to B1 via a green arrow.
- X2 receives input from A2 and outputs to B1 via a green arrow.
3. **Output Node (B1)**:
- B1 aggregates inputs from both X1 and X2, acting as the terminal node.
### Key Observations
- **Flow Direction**: All arrows point downward, indicating a unidirectional flow from top (inputs) to bottom (output).
- **Symmetry**: X1 and X2 have identical roles (receiving inputs and outputting to B1), but their input sources differ (A1/C1 vs. A2).
- **Color Consistency**: Blue arrows dominate the input layer, while green arrows dominate the output layer, reinforcing functional separation.
### Interpretation
This diagram likely represents a **workflow or system architecture** where:
- **A1, C1, and A2** are independent input sources or processes.
- **X1 and X2** act as processing units that consolidate inputs before passing results to **B1**, the final output.
- The use of distinct arrow colors (blue for inputs, green for outputs) emphasizes modularity and separation of concerns.
The absence of numerical data or explicit labels for relationships suggests the diagram focuses on **structural relationships** rather than quantitative metrics. The symmetry between X1 and X2 implies redundancy or parallel processing capabilities in the system.