## Line Chart: Throughput vs. Hidden Size for Different Tensor Parallelism (TP) Settings
### Overview
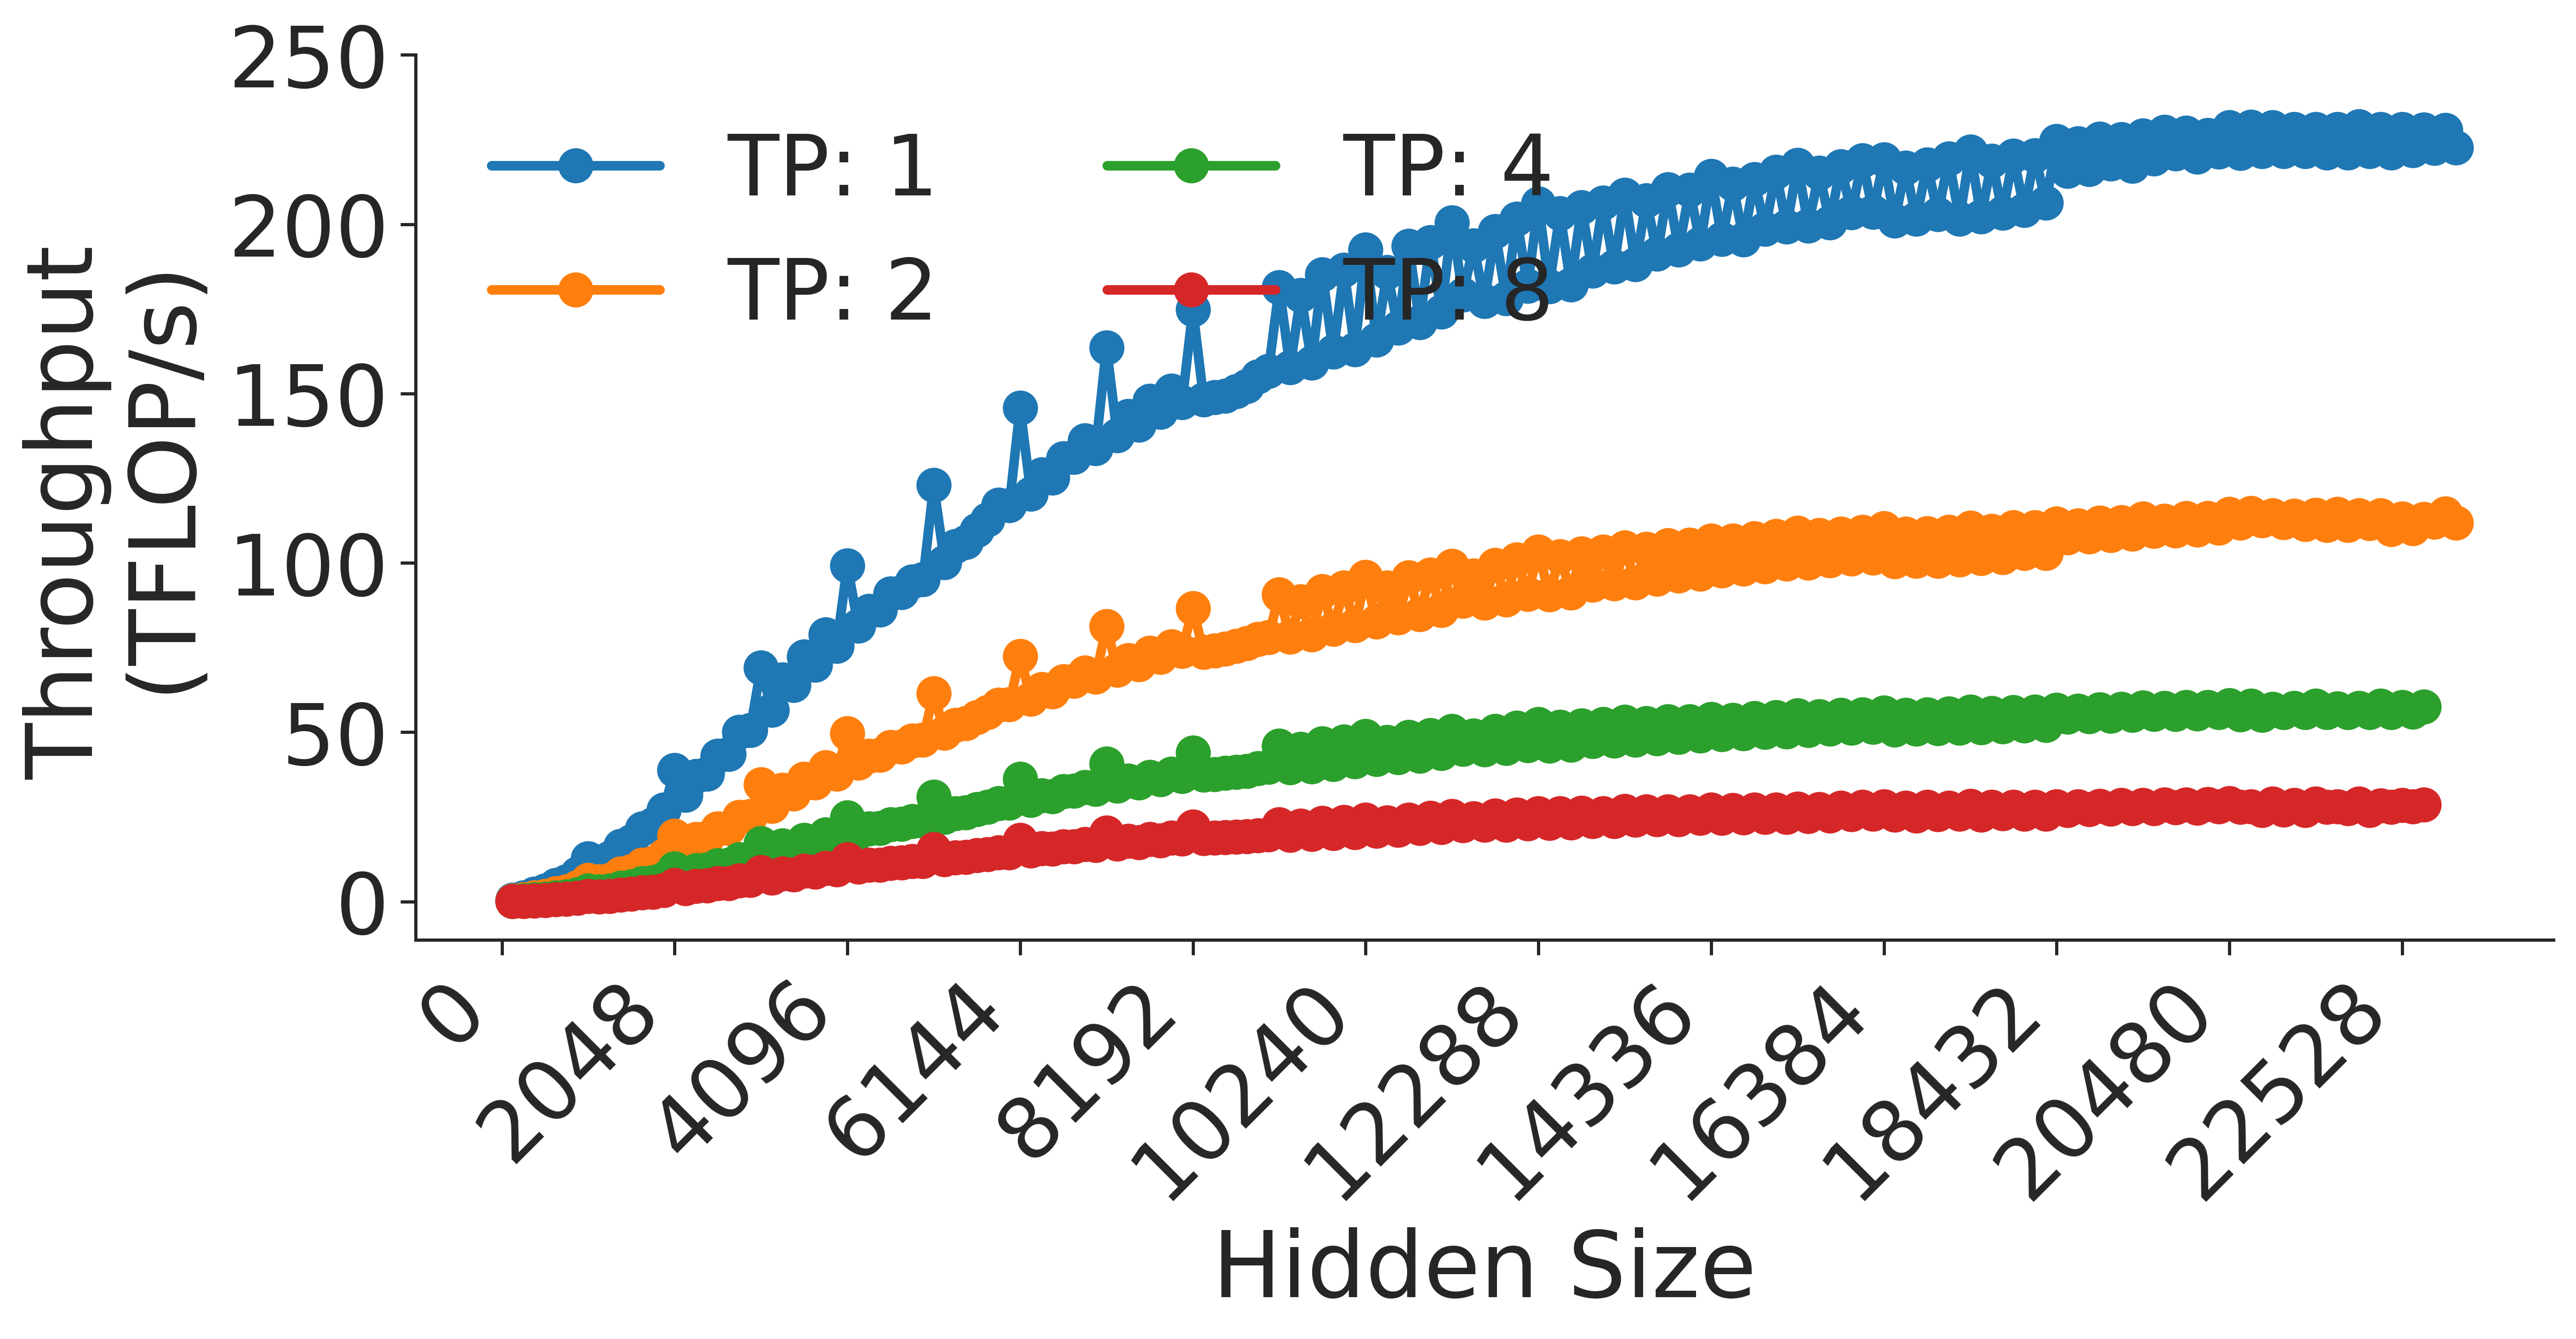
This chart illustrates the performance characteristics of a computational workload (likely a neural network model) by plotting "Throughput (TFLOP/s)" against "Hidden Size." The data is segmented into four distinct series representing different Tensor Parallelism (TP) configurations: TP: 1, TP: 2, TP: 4, and TP: 8.
### Components/Axes
* **Y-Axis (Vertical):** Labeled "Throughput (TFLOP/s)". The scale ranges from 0 to 250, with major tick marks every 50 units.
* **X-Axis (Horizontal):** Labeled "Hidden Size". The scale ranges from 0 to 22528. The axis markers are spaced at intervals of 2048 (0, 2048, 4096, 6144, 8192, 10240, 12288, 14336, 16384, 18432, 20480, 22528).
* **Legend:** Positioned in the top-left quadrant of the chart area.
* **Blue line with circular markers:** TP: 1
* **Orange line with circular markers:** TP: 2
* **Green line with circular markers:** TP: 4
* **Red line with circular markers:** TP: 8
### Detailed Analysis
The chart displays four data series, all of which exhibit a positive correlation: as the Hidden Size increases, the Throughput (TFLOP/s) increases. However, the rate of increase diminishes as the Hidden Size grows, indicating a saturation point for all configurations.
**Trend Verification & Data Points (Approximate):**
* **TP: 1 (Blue Line):**
* **Trend:** This series shows the highest throughput but also the highest volatility. It slopes upward steeply until approximately 8192, then continues to rise at a slower rate.
* **Values:**
* At Hidden Size 4096: ~50 TFLOP/s.
* At Hidden Size 8192: ~150 TFLOP/s.
* At Hidden Size 12288: ~175 TFLOP/s.
* At Hidden Size 22528: ~225 TFLOP/s.
* **Note:** There are distinct, sharp spikes in the data between Hidden Size 6144 and 12288, suggesting performance instability or specific kernel optimization behaviors at these sizes.
* **TP: 2 (Orange Line):**
* **Trend:** Consistent upward slope, significantly lower throughput than TP: 1.
* **Values:**
* At Hidden Size 4096: ~30 TFLOP/s.
* At Hidden Size 8192: ~75 TFLOP/s.
* At Hidden Size 22528: ~110 TFLOP/s.
* **TP: 4 (Green Line):**
* **Trend:** Steady, moderate upward slope.
* **Values:**
* At Hidden Size 4096: ~15 TFLOP/s.
* At Hidden Size 8192: ~40 TFLOP/s.
* At Hidden Size 22528: ~60 TFLOP/s.
* **TP: 8 (Red Line):**
* **Trend:** The lowest throughput, with the most stable and linear growth pattern.
* **Values:**
* At Hidden Size 4096: ~10 TFLOP/s.
* At Hidden Size 8192: ~20 TFLOP/s.
* At Hidden Size 22528: ~30 TFLOP/s.
### Key Observations
1. **Inverse Efficiency:** There is a clear inverse relationship between the degree of Tensor Parallelism (TP) and the achieved throughput. TP: 1 achieves the highest throughput, while TP: 8 achieves the lowest.
2. **Volatility:** The TP: 1 configuration exhibits significant "jitter" or spikes in performance, particularly in the mid-range of the hidden sizes (6144–12288). The other configurations (TP: 2, 4, 8) are much smoother.
3. **Diminishing Returns:** All four lines show a "knee" in the curve, where the slope flattens as the hidden size increases, suggesting that the system reaches a compute or memory bandwidth limit.
### Interpretation
* **What the data demonstrates:** This chart likely depicts the performance of a Large Language Model (LLM) training or inference workload on a GPU cluster. Tensor Parallelism (TP) is a technique used to split a model across multiple GPUs to fit larger models into memory.
* **The Trade-off:** The data clearly demonstrates the "cost" of Tensor Parallelism. While increasing TP allows for larger models (or larger hidden sizes) to be processed, it introduces significant communication overhead (all-reduce operations between GPUs), which drastically reduces the effective throughput.
* **Performance Anomalies:** The volatility in the TP: 1 line suggests that at certain hidden sizes, the GPU kernels are not perfectly optimized, or there are memory alignment issues (e.g., non-optimal matrix dimensions for the hardware's tensor cores). The smoother lines for higher TP values suggest that the communication overhead dominates the execution time, masking the underlying kernel-level inefficiencies seen in the TP: 1 configuration.