## Flowchart: Wind Power Output Simulation Process
### Overview
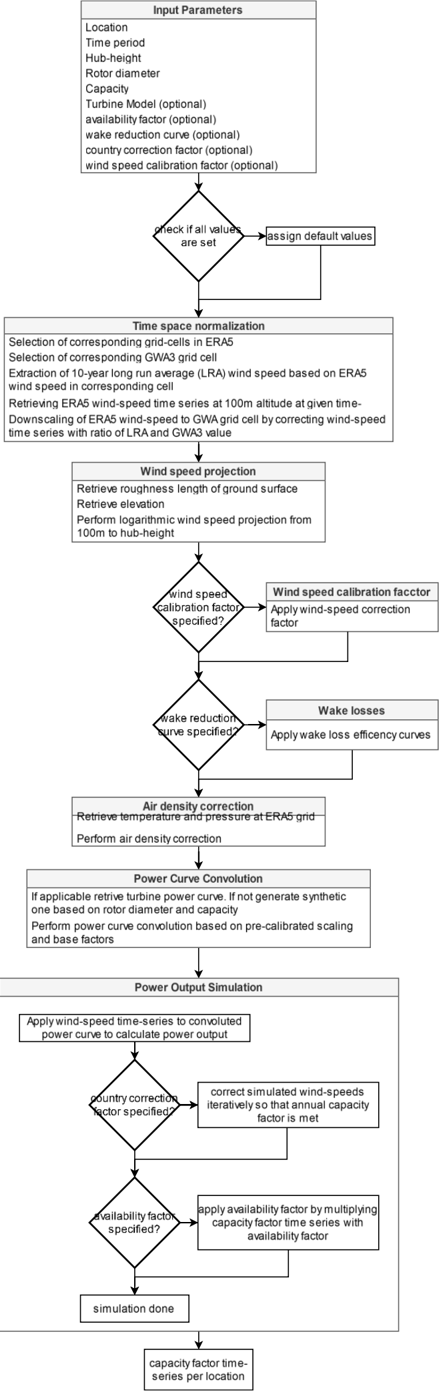
This flowchart outlines a technical process for simulating wind turbine power output, integrating meteorological data, turbine specifications, and correction factors. The process begins with input parameters, progresses through data normalization, wind speed modeling, and power curve convolution, culminating in a capacity factor time series.
### Components/Axes
1. **Input Parameters** (Top Section):
- Mandatory: Location, Time period, Hub-height, Rotor diameter, Capacity
- Optional: Turbine Model, Availability factor, Wake reduction curve, Country correction factor, Wind speed calibration factor
2. **Decision Nodes** (Diamond shapes):
- "Check if all values are set"
- "Wind speed calibration factor specified?"
- "Wake reduction curve specified?"
- "Country correction factor specified?"
- "Availability factor specified?"
3. **Process Steps** (Rectangle shapes):
- Time space normalization
- Wind speed projection
- Air density correction
- Power curve convolution
- Power output simulation
### Detailed Analysis
1. **Time Space Normalization**:
- Aligns ERA5 grid-cell wind-speed data with GWA3 grid-cell data
- Uses 10-year long-run average (LRA) for wind-speed extraction
- Downsamples ERA5 data to match GWA3 resolution via LRA/GWA3 ratio
2. **Wind Speed Projection**:
- Retrieves ground surface roughness and elevation data
- Projects wind speed from 100m to hub-height using logarithmic interpolation
3. **Air Density Correction**:
- Adjusts for temperature and pressure variations at ERA5 grid locations
4. **Power Curve Convolution**:
- Generates turbine power curves using rotor diameter and capacity
- Applies pre-calibrated scaling if synthetic curves aren't feasible
5. **Power Output Simulation**:
- Applies wind-speed time series to power curves
- Iteratively adjusts simulated wind speeds to meet annual capacity factor targets
- Incorporates country-specific correction factors and availability factors
### Key Observations
- **Mandatory vs Optional Parameters**: 7 mandatory inputs vs 5 optional correction factors
- **Data Flow**: Vertical progression from raw meteorological data to final capacity factor output
- **Iterative Adjustment**: Final power output simulation includes iterative wind-speed correction
- **Geospatial Considerations**: Explicit handling of hub-height adjustments and ground surface roughness
### Interpretation
This process demonstrates a comprehensive approach to wind resource assessment and power output prediction. The flowchart emphasizes:
1. **Data Harmonization**: Aligning different resolution datasets (ERA5 vs GWA3)
2. **Physical Adjustments**: Accounting for terrain effects (hub-height projection) and atmospheric conditions (air density)
3. **Operational Realities**: Incorporating turbine-specific parameters and availability factors
4. **Iterative Optimization**: Final simulation adjusts outputs to meet capacity targets
The process reveals dependencies between meteorological data quality and final output accuracy, particularly in how wind-speed calibration and wake loss modeling directly impact power curve performance. The optional parameters suggest flexibility for site-specific adjustments while maintaining core simulation integrity.