## Flowchart Diagram: Cyclic Process Flow
### Overview
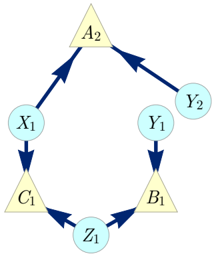
The image depicts a cyclic flowchart with seven nodes connected by directional arrows. The nodes alternate between triangular (A2, B1, C1) and circular (X1, Y1, Y2, Z1) shapes. Arrows indicate a unidirectional flow from one node to the next, forming a closed loop. Colors are used to differentiate node types: yellow for triangles, light blue for circles, and dark blue for arrows.
### Components/Axes
- **Nodes**:
- Triangular: A2 (top), B1 (bottom-right), C1 (bottom-left)
- Circular: X1 (left), Y1 (bottom-right), Y2 (top-right), Z1 (bottom-center)
- **Arrows**: Dark blue, unidirectional, connecting nodes in sequence.
- **No explicit legend**: Colors are descriptive but not formally labeled.
- **No axes or scales**: Diagram focuses on logical flow rather than quantitative data.
### Detailed Analysis
1. **Flow Sequence**:
- A2 → X1 → C1 → Z1 → B1 → Y1 → Y2 → A2
- Forms a closed loop with no branching or termination points.
2. **Node Relationships**:
- Triangular nodes (A2, B1, C1) act as decision points or process stages.
- Circular nodes (X1, Y1, Y2, Z1) represent data inputs, outputs, or intermediate states.
3. **Color Coding**:
- Yellow triangles (A2, B1, C1) may signify critical stages or decision nodes.
- Light blue circles (X1, Y1, Y2, Z1) likely denote data or resource nodes.
- Dark blue arrows emphasize directional flow.
### Key Observations
- **Cyclic Nature**: The loop suggests a repeating process (e.g., workflow, data pipeline, or feedback system).
- **Symmetry**: The arrangement of nodes creates a balanced, hexagonal-like structure.
- **No Outliers**: All nodes are equally connected; no node is isolated or bypassed.
### Interpretation
This diagram likely represents a **closed-loop system** where each node contributes to a continuous cycle. For example:
- **A2** could initiate a process (e.g., data collection).
- **X1, Y1, Y2, Z1** might represent data transformations or resource allocations.
- **B1 and C1** could act as decision gates or validation steps before returning to A2.
The absence of a legend or numerical data implies the focus is on **logical flow** rather than quantitative analysis. The symmetry and uniformity suggest a designed, intentional process with no inherent inefficiencies or bottlenecks. Further context (e.g., labels for nodes) would clarify the specific application (e.g., business workflow, scientific experiment, or software architecture).