## Scatter Plot: Accuracy vs. Time-to-Answer for Different Inference Methods
### Overview
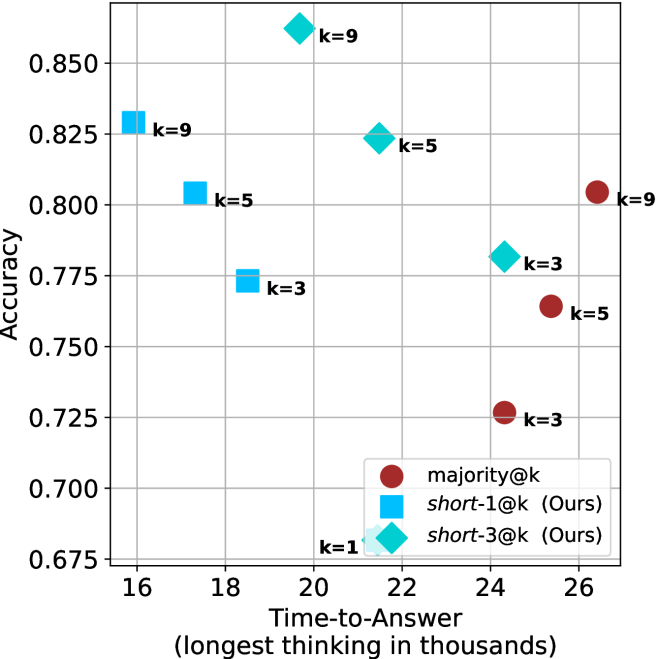
This scatter plot visualizes the performance trade-offs between three different inference methods—`majority@k`, `short-1@k` (Ours), and `short-3@k` (Ours)—across varying values of 'k'. The chart maps "Accuracy" (y-axis) against "Time-to-Answer" (x-axis), demonstrating how different methods balance computational time with predictive performance.
### Components/Axes
* **Y-Axis:** "Accuracy", ranging from 0.675 to 0.850, with grid lines at 0.025 intervals.
* **X-Axis:** "Time-to-Answer (longest thinking in thousands)", ranging from 16 to 26, with grid lines at 2-unit intervals.
* **Legend:** Located in the bottom-right quadrant.
* **Red Circle:** `majority@k`
* **Blue Square:** `short-1@k (Ours)`
* **Cyan Diamond:** `short-3@k (Ours)`
### Detailed Analysis
The data points are grouped by method and labeled with their respective 'k' values.
**1. `short-1@k` (Blue Squares)**
* *Trend:* As 'k' increases from 3 to 9, the data points move up and to the left, indicating that higher 'k' values yield both higher accuracy and faster response times.
* *Data Points:*
* **k=3:** x ≈ 18.5, y ≈ 0.775
* **k=5:** x ≈ 17.3, y ≈ 0.805
* **k=9:** x ≈ 16.3, y ≈ 0.830
**2. `short-3@k` (Cyan Diamonds)**
* *Trend:* Similar to `short-1@k`, as 'k' increases from 3 to 9, the accuracy improves significantly while the time-to-answer decreases.
* *Data Points:*
* **k=1:** x ≈ 21.5, y ≈ 0.682 (Outlier/Baseline)
* **k=3:** x ≈ 24.3, y ≈ 0.782
* **k=5:** x ≈ 21.5, y ≈ 0.825
* **k=9:** x ≈ 19.7, y ≈ 0.865
**3. `majority@k` (Red Circles)**
* *Trend:* As 'k' increases from 3 to 9, the data points move up and to the right. While accuracy improves, the time-to-answer also increases, indicating a computational cost for higher accuracy.
* *Data Points:*
* **k=3:** x ≈ 24.3, y ≈ 0.727
* **k=5:** x ≈ 25.4, y ≈ 0.765
* **k=9:** x ≈ 26.5, y ≈ 0.805
### Key Observations
* **Efficiency Dominance:** The "Ours" methods (`short-1@k` and `short-3@k`) consistently outperform the `majority@k` baseline. They achieve higher accuracy scores while generally requiring less time-to-answer.
* **Optimal Performance:** The `short-3@k` method at k=9 achieves the highest accuracy on the chart (~0.865) while maintaining a moderate time-to-answer (~19.7).
* **Inverse Relationship in "Ours" Methods:** Unusually, for the "Ours" methods, increasing 'k' results in *faster* times. This suggests that these methods may be optimizing the "longest thinking" path as 'k' increases, rather than simply accumulating more computation.
* **Baseline Inefficiency:** The `majority@k` method shows a standard trade-off: to get more accuracy, you must spend more time.
### Interpretation
The data demonstrates that the proposed methods (`short-1@k` and `short-3@k`) are superior to the `majority@k` baseline in this specific context. Not only do they reach higher absolute accuracy peaks, but they also exhibit a "win-win" scenario where increasing the 'k' parameter improves accuracy while simultaneously reducing the "longest thinking" time. This suggests the "Ours" algorithms are likely pruning or optimizing the search space more effectively as the 'k' parameter grows, whereas the `majority@k` method likely performs a brute-force or linear accumulation of computation time as 'k' increases.