## Line Chart: Pass@1 over Iterations per Model (with Variance)
### Overview
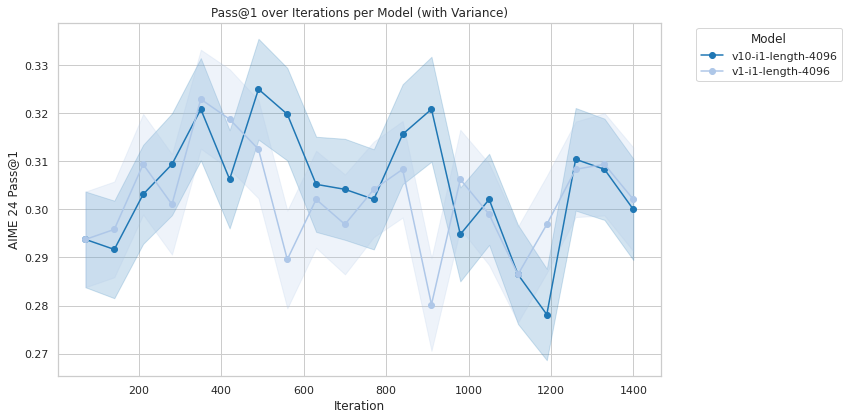
This chart illustrates the performance of two distinct models, labeled "v10-i1-length-4096" and "v1-i1-length-4096," on the AIME 24 benchmark. The Y-axis represents the "Pass@1" score, while the X-axis represents training "Iteration." The chart includes shaded regions around each line, representing the variance (confidence interval) for each data point.
### Components/Axes
* **Chart Type:** Time-series line chart with shaded variance bands.
* **X-Axis:** Labeled "Iteration." The scale ranges from 0 to 1400, with major grid lines at 200-unit intervals.
* **Y-Axis:** Labeled "AIME 24 Pass@1." The scale ranges from 0.27 to 0.33, with major grid lines at 0.01 intervals.
* **Legend:** Positioned in the top-right corner.
* **v10-i1-length-4096:** Represented by a dark blue line with circular markers.
* **v1-i1-length-4096:** Represented by a light blue line with circular markers.
### Detailed Analysis
The data points are extracted based on visual estimation relative to the grid lines.
**1. v10-i1-length-4096 (Dark Blue Line)**
* **Trend:** The line exhibits high volatility. It trends upward from the start, peaks twice (around iteration 500 and 700), experiences a sharp decline around iteration 1200, and recovers slightly toward the end.
* **Key Data Points (Approximate):**
* Start (~100): 0.294
* ~350: 0.321
* ~500: 0.325 (Peak)
* ~700: 0.320
* ~850: 0.316
* ~1200: 0.278 (Significant trough)
* ~1300: 0.310
* End (~1400): 0.300
**2. v1-i1-length-4096 (Light Blue Line)**
* **Trend:** This line also shows significant volatility. It peaks early (around iteration 350), followed by a general downward trend with a sharp drop at iteration 900, before recovering toward the end.
* **Key Data Points (Approximate):**
* Start (~100): 0.294
* ~350: 0.323 (Peak)
* ~500: 0.313
* ~700: 0.297
* ~900: 0.280 (Significant trough)
* ~1000: 0.306
* ~1200: 0.297
* End (~1400): 0.302
### Key Observations
* **Volatility:** Both models exhibit unstable performance, with Pass@1 scores fluctuating significantly between iterations. This suggests that the training process or the evaluation metric is sensitive to the specific checkpoint.
* **Divergence:** The models diverge significantly between iterations 500 and 1200. The dark blue model (v10) generally outperforms the light blue model (v1) in the middle phase of training, despite the dark blue model's sharp drop at iteration 1200.
* **Variance:** The shaded regions (variance) are relatively consistent in width across the timeline, though they appear slightly wider during the peak performance periods, suggesting higher uncertainty when the models achieve higher scores.
* **Outliers:** The sharp drop in the dark blue model at iteration 1200 (0.278) and the light blue model at iteration 900 (0.280) are notable anomalies, representing the lowest performance points for each respective model.
### Interpretation
The data demonstrates that neither model achieves a stable convergence point within the 1400 iterations shown. The high variance and frequent "sawtooth" pattern (sharp rises followed by sharp drops) are characteristic of training runs where the model may be overfitting to specific batches or where the evaluation benchmark (AIME 24) is highly sensitive to the model's current state.
The "v10" model appears to have a higher ceiling (reaching ~0.325) compared to the "v1" model (reaching ~0.323), but it is also prone to more dramatic performance degradation. The fact that both models end near the 0.300 mark suggests that despite the fluctuations, they settle into a similar performance range by the end of the training duration.