TECHNICAL ASSET FINGERPRINT
d7cab08c78e0ce91b8ca2352
Click to view fullscreen
Press ESC or click to close
FOUND IN PAPERS
EXPERT: healer-alpha-free VERSION 1
RUNTIME: free/openrouter/healer-alpha
INTEL_VERIFIED
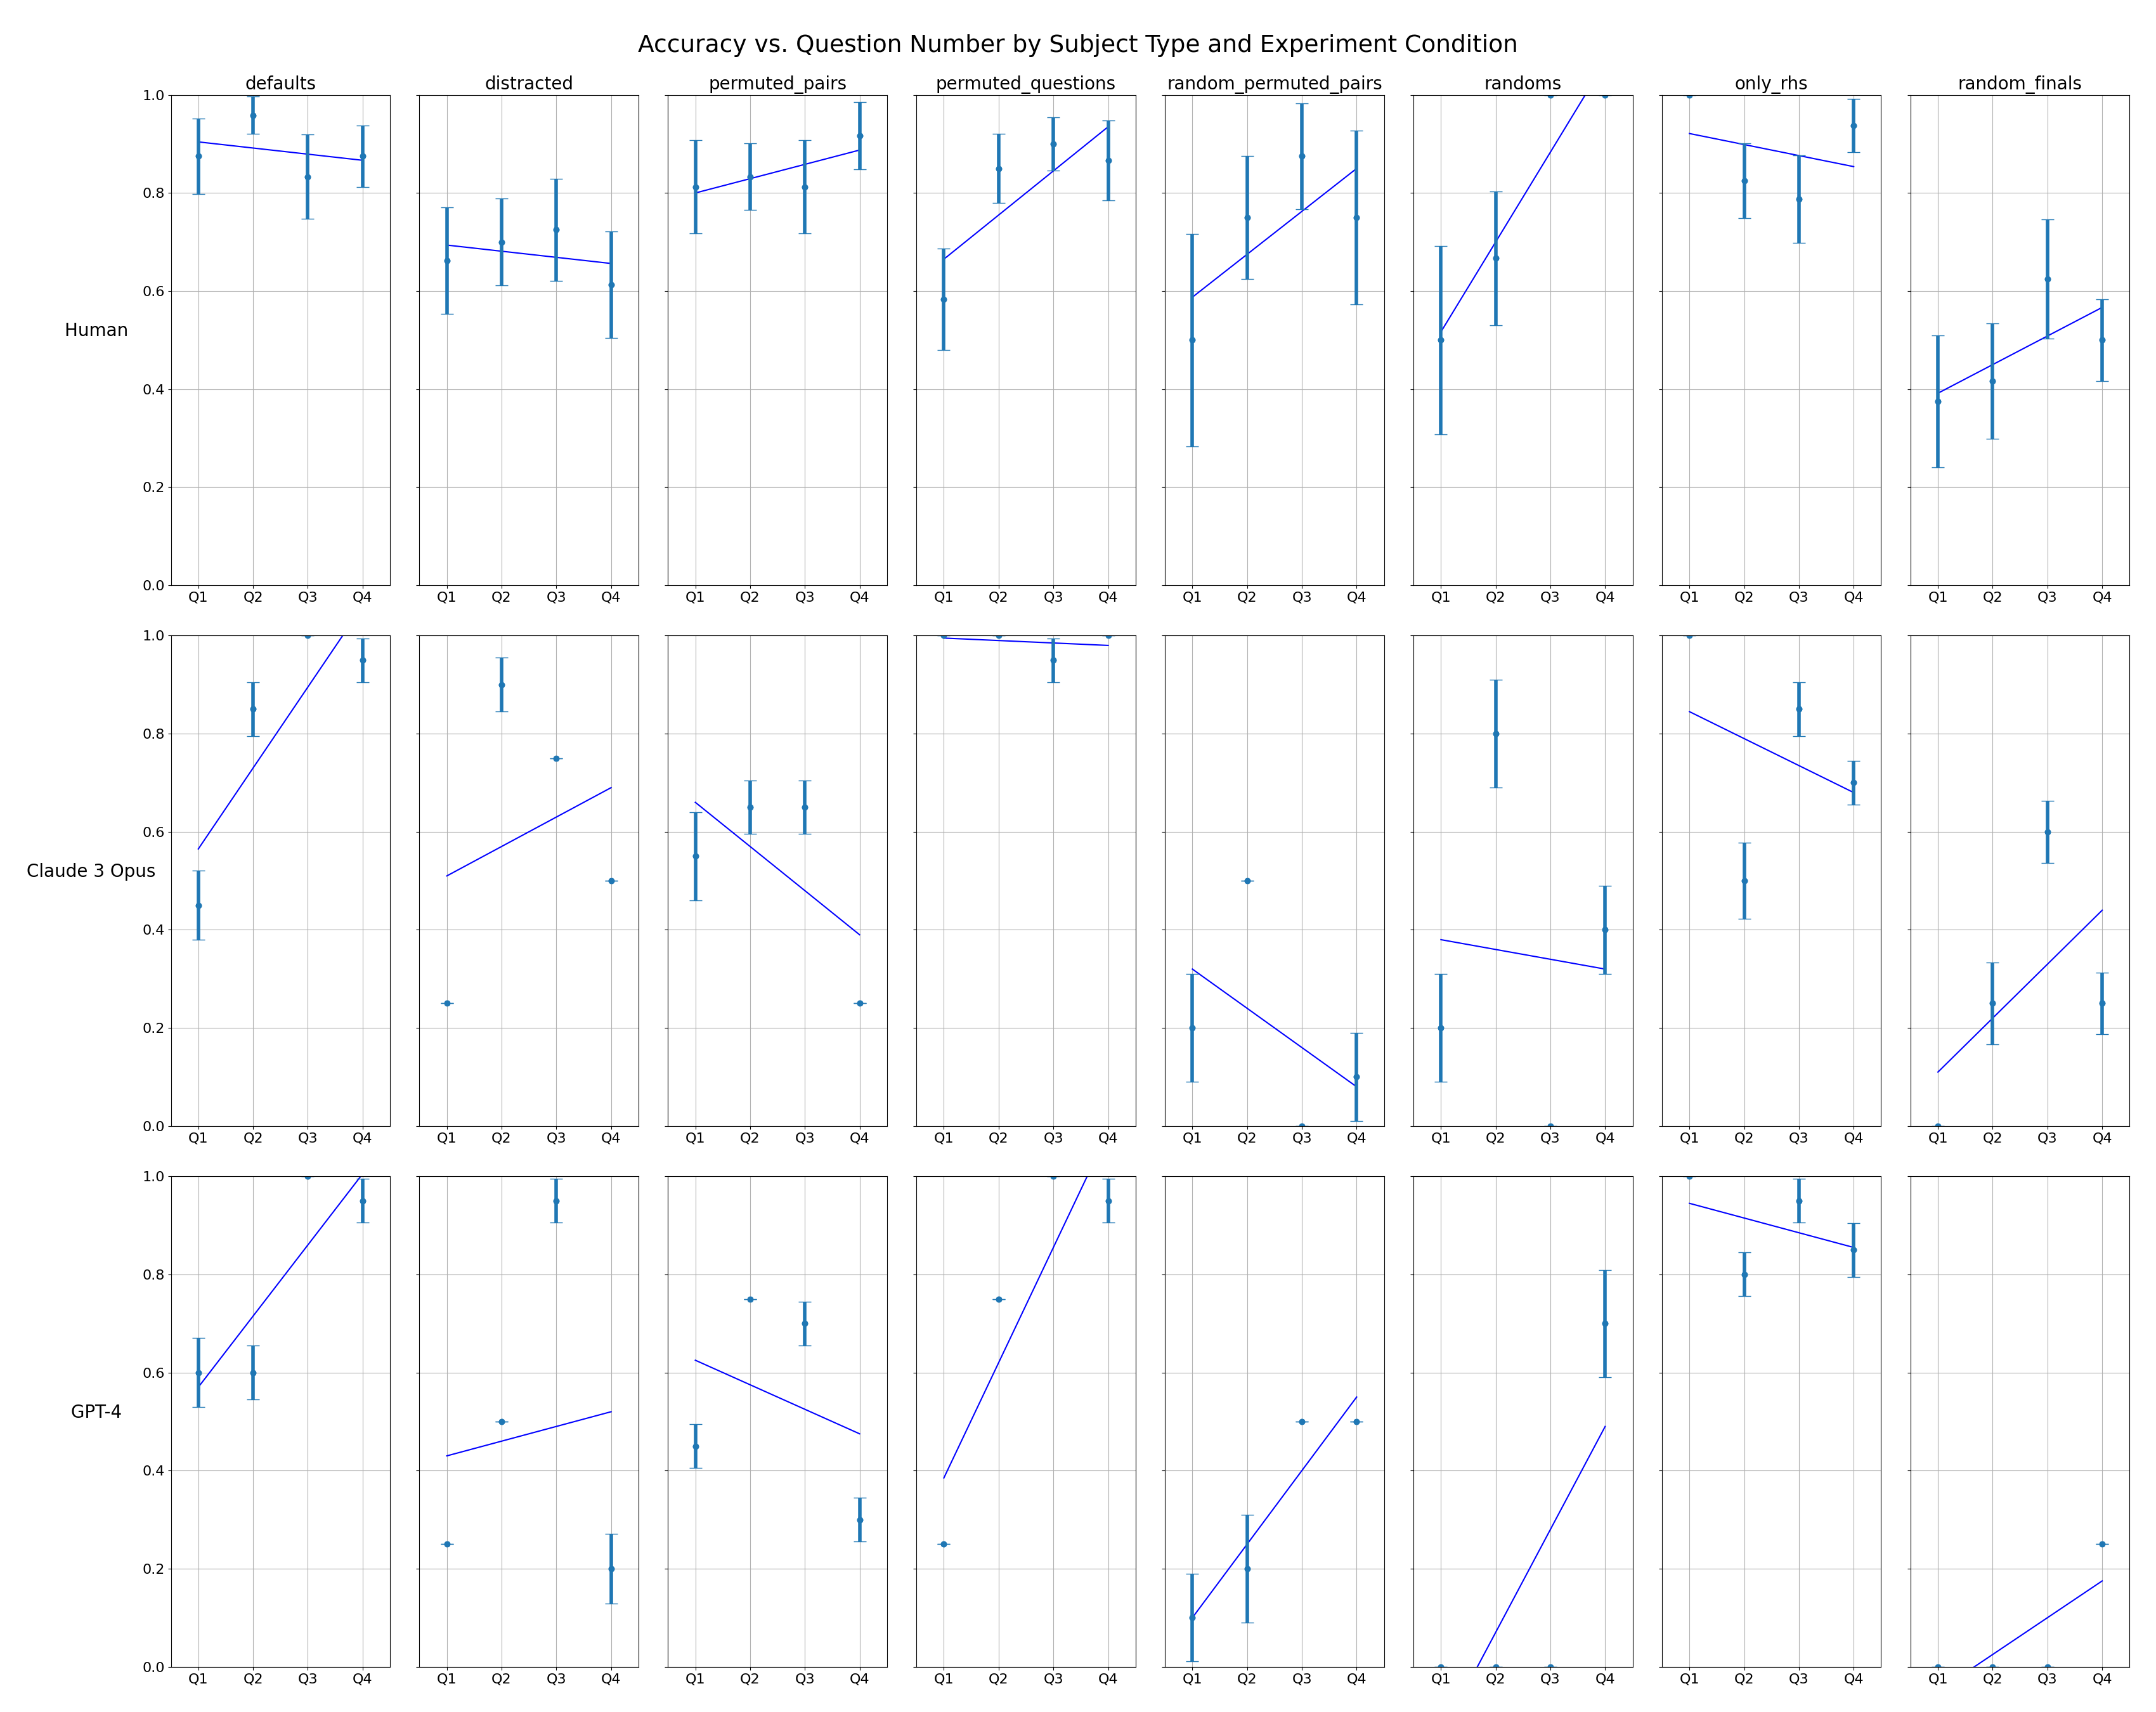
## [Multi-Panel Line Chart]: Accuracy vs. Question Number by Subject Type and Experiment Condition
### Overview
The image is a 3x8 grid of line charts (24 subplots total) displaying the accuracy of three different subjects (Human, Claude 3 Opus, GPT-4) across eight experimental conditions. Each subplot plots accuracy (y-axis) against question number (Q1, Q2, Q3, Q4) for a specific subject-condition pair. Blue lines connect the mean accuracy points, and vertical error bars indicate variability (likely standard deviation or confidence intervals).
### Components/Axes
* **Overall Title:** "Accuracy vs. Question Number by Subject Type and Experiment Condition"
* **Row Labels (Subject Type):** Located on the far left of each row.
* Row 1: `Human`
* Row 2: `Claude 3 Opus`
* Row 3: `GPT-4`
* **Column Headers (Experiment Condition):** Located at the top of each column.
* Column 1: `defaults`
* Column 2: `distracted`
* Column 3: `permuted_pairs`
* Column 4: `permuted_questions`
* Column 5: `random_permuted_pairs`
* Column 6: `randoms`
* Column 7: `only_rhs`
* Column 8: `random_finals`
* **Axes (within each subplot):**
* **Y-axis:** Label is implied by the overall title. Scale is from `0.0` to `1.0` (representing 0% to 100% accuracy). Major gridlines are at 0.0, 0.2, 0.4, 0.6, 0.8, 1.0.
* **X-axis:** Discrete categories: `Q1`, `Q2`, `Q3`, `Q4`.
* **Data Representation:** Blue line connecting data points with vertical error bars.
### Detailed Analysis
**Row 1: Human**
* **defaults:** Starts high (~0.9 at Q1), slight dip at Q2 (~0.85), stabilizes around 0.85-0.9 for Q3-Q4. Trend: Slight decline then stable.
* **distracted:** Starts ~0.7 at Q1, declines steadily to ~0.6 at Q4. Trend: Downward.
* **permuted_pairs:** Starts ~0.8 at Q1, rises to ~0.9 at Q4. Trend: Upward.
* **permuted_questions:** Starts lower (~0.6 at Q1), rises sharply to ~0.9 at Q4. Trend: Strong upward.
* **random_permuted_pairs:** Starts ~0.6 at Q1, rises to ~0.8 at Q4. Trend: Upward.
* **randoms:** Starts low (~0.5 at Q1), rises sharply to 1.0 at Q4. Trend: Strong upward.
* **only_rhs:** Starts high (~0.9 at Q1), declines slightly to ~0.85 at Q4. Trend: Slight downward.
* **random_finals:** Starts low (~0.4 at Q1), rises to ~0.6 at Q4. Trend: Upward.
**Row 2: Claude 3 Opus**
* **defaults:** Starts low (~0.4 at Q1), rises steeply to 1.0 at Q4. Trend: Strong upward.
* **distracted:** Starts very low (~0.25 at Q1), jumps to ~0.9 at Q2, then declines to ~0.5 at Q4. Trend: Sharp rise then decline.
* **permuted_pairs:** Starts ~0.6 at Q1, declines to ~0.4 at Q4. Trend: Downward.
* **permuted_questions:** Flat at 1.0 across all questions. Trend: Perfect and stable.
* **random_permuted_pairs:** Starts ~0.3 at Q1, declines to ~0.1 at Q4. Trend: Downward.
* **randoms:** Starts ~0.2 at Q1, rises to ~0.4 at Q4. Trend: Upward.
* **only_rhs:** Starts ~0.85 at Q1, declines to ~0.7 at Q4. Trend: Downward.
* **random_finals:** Starts ~0.1 at Q1, rises to ~0.4 at Q4. Trend: Upward.
**Row 3: GPT-4**
* **defaults:** Starts ~0.6 at Q1, rises to 1.0 at Q4. Trend: Upward.
* **distracted:** Starts ~0.25 at Q1, rises to ~0.5 at Q4. Trend: Upward.
* **permuted_pairs:** Starts ~0.45 at Q1, declines to ~0.3 at Q4. Trend: Downward.
* **permuted_questions:** Starts ~0.25 at Q1, rises steeply to 1.0 at Q4. Trend: Strong upward.
* **random_permuted_pairs:** Starts ~0.1 at Q1, rises to ~0.5 at Q4. Trend: Upward.
* **randoms:** Starts at 0.0 at Q1, rises to ~0.5 at Q4. Trend: Strong upward.
* **only_rhs:** Starts ~0.95 at Q1, declines to ~0.85 at Q4. Trend: Slight downward.
* **random_finals:** Starts at 0.0 at Q1, rises to ~0.25 at Q4. Trend: Upward.
### Key Observations
1. **Performance Variability:** There is extreme variability in performance trends across subjects and conditions. No single pattern dominates.
2. **Human Consistency:** Human performance is generally more stable and less prone to extreme swings (e.g., from 0 to 1) compared to the AI models.
3. **AI Model Extremes:** Claude 3 Opus and GPT-4 show more dramatic performance shifts, including perfect scores (1.0) and near-zero scores (0.0) in certain conditions.
4. **Condition Impact:** The `permuted_questions` condition yields perfect accuracy for Claude 3 Opus but shows a strong learning curve for Humans and GPT-4. The `distracted` condition appears particularly harmful to initial performance for all subjects.
5. **Error Bars:** Error bars are generally larger for lower accuracy scores and for the AI models in challenging conditions, indicating higher uncertainty or variance in their responses.
### Interpretation
This chart likely comes from a study comparing human and AI reasoning or problem-solving across a sequence of questions under different cognitive or structural manipulations.
* **What the data suggests:** The experiment tests how performance evolves over a short sequence (Q1-Q4) when the problem format is altered (permuted, randomized, distracted). The stark differences between subjects suggest that humans and current large language models (Claude 3 Opus, GPT-4) employ fundamentally different strategies or have different vulnerabilities to these manipulations.
* **How elements relate:** The grid structure allows direct comparison. For example, one can see that while Humans struggle with `distracted` (downward trend), GPT-4 shows improvement (upward trend), suggesting different attention mechanisms. The perfect flat line for Claude 3 Opus in `permuted_questions` indicates it may have a robust internal representation unaffected by question order, unlike Humans who must learn the pattern.
* **Notable anomalies:**
* Claude 3 Opus's `permuted_questions` performance is an outlier—perfect from the start.
* GPT-4's `randoms` condition starts at 0.0 accuracy, suggesting complete failure on the first question, but shows rapid adaptation.
* The `only_rhs` condition (possibly "only right-hand side" of an equation) shows a consistent slight downward trend for all subjects, implying it introduces a subtle but persistent difficulty.
* **Underlying investigation:** The data probes the robustness and adaptability of reasoning systems. The trends help identify which types of problem transformations are most disruptive to different kinds of intelligence, informing both cognitive science and AI alignment research. The presence of learning curves (upward trends) versus degradation curves (downward trends) reveals whether a subject is adapting to the task structure or being confused by it.
DECODING INTELLIGENCE...