## Line Graph: Cost per Sequence vs. Sequence Number (Thousands)
### Overview
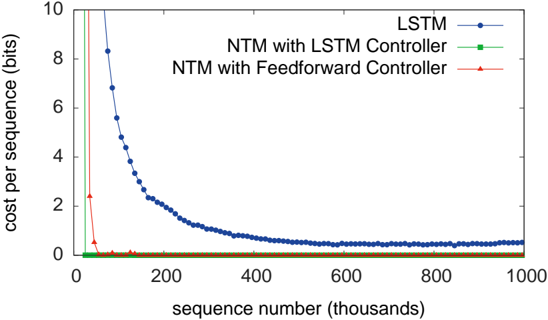
The image is a line graph comparing the cost per sequence (in bits) across three different models: LSTM, NTM with LSTM Controller, and NTM with Feedforward Controller. The x-axis represents sequence numbers (in thousands), and the y-axis represents cost per sequence (in bits). The graph shows distinct trends for each model, with the LSTM model exhibiting a sharp decline in cost, while the NTM controllers remain stable at near-zero cost.
---
### Components/Axes
- **X-axis**: Labeled "sequence number (thousands)", ranging from 0 to 1000 (in thousands).
- **Y-axis**: Labeled "cost per sequence (bits)", ranging from 0 to 10.
- **Legend**: Located on the right side of the graph, with three entries:
- **Blue line with circles**: LSTM
- **Green line with squares**: NTM with LSTM Controller
- **Red line with triangles**: NTM with Feedforward Controller
---
### Detailed Analysis
1. **LSTM (Blue Line)**:
- Starts at approximately **8.5 bits** at sequence 0.
- Declines sharply to **~0.5 bits** by sequence 200k.
- Plateaus at **~0.5 bits** for sequences 200k–1000k.
- Data points are plotted as circles.
2. **NTM with LSTM Controller (Green Line)**:
- Remains at **0 bits** for all sequence numbers.
- Data points are plotted as squares.
3. **NTM with Feedforward Controller (Red Line)**:
- Remains at **0 bits** for all sequence numbers.
- Data points are plotted as triangles.
---
### Key Observations
- The LSTM model shows a **rapid decrease in cost** (from ~8.5 to ~0.5 bits) over the first 200k sequences, followed by stabilization.
- Both NTM controllers (LSTM and Feedforward) maintain **zero cost** across all sequence numbers, indicating perfect efficiency or no cost incurred.
- The LSTM model’s cost reduction suggests improved performance or optimization over time, while the NTM controllers are consistently optimal from the start.
---
### Interpretation
- **LSTM Behavior**: The sharp decline in cost for the LSTM model implies that its performance improves as it processes more sequences, possibly due to learning or adaptive mechanisms. The plateau at ~0.5 bits suggests a lower bound on its efficiency.
- **NTM Controllers**: The NTM with LSTM Controller and NTM with Feedforward Controller both achieve **zero cost**, indicating they are either inherently more efficient or designed to avoid cost entirely. This could reflect architectural advantages or task-specific optimizations.
- **Comparison**: The LSTM model starts with higher costs but converges toward the NTM controllers’ efficiency over time. This highlights a trade-off between initial performance and long-term optimization.
---
### Spatial Grounding and Trend Verification
- **Legend Placement**: Right-aligned, clearly associating colors with models.
- **Line Trends**:
- LSTM (blue): Steep downward slope followed by a flat line.
- NTM Controllers (green/red): Horizontal lines at 0.
- **Data Point Consistency**: All data points match their legend colors (blue circles for LSTM, green squares for NTM with LSTM Controller, red triangles for NTM with Feedforward Controller).
---
### Content Details
- **LSTM Data Points**:
- Sequence 0: ~8.5 bits
- Sequence 200k: ~0.5 bits
- Sequence 1000k: ~0.5 bits
- **NTM Controllers**: All data points at 0 bits across all sequences.
---
### Final Notes
The graph demonstrates that while LSTM models improve efficiency over time, NTM controllers with specialized architectures (LSTM or Feedforward) achieve optimal performance from the outset. This could inform decisions about model selection based on computational constraints and task requirements.