# Technical Data Extraction: Performance Metrics Across Datasets
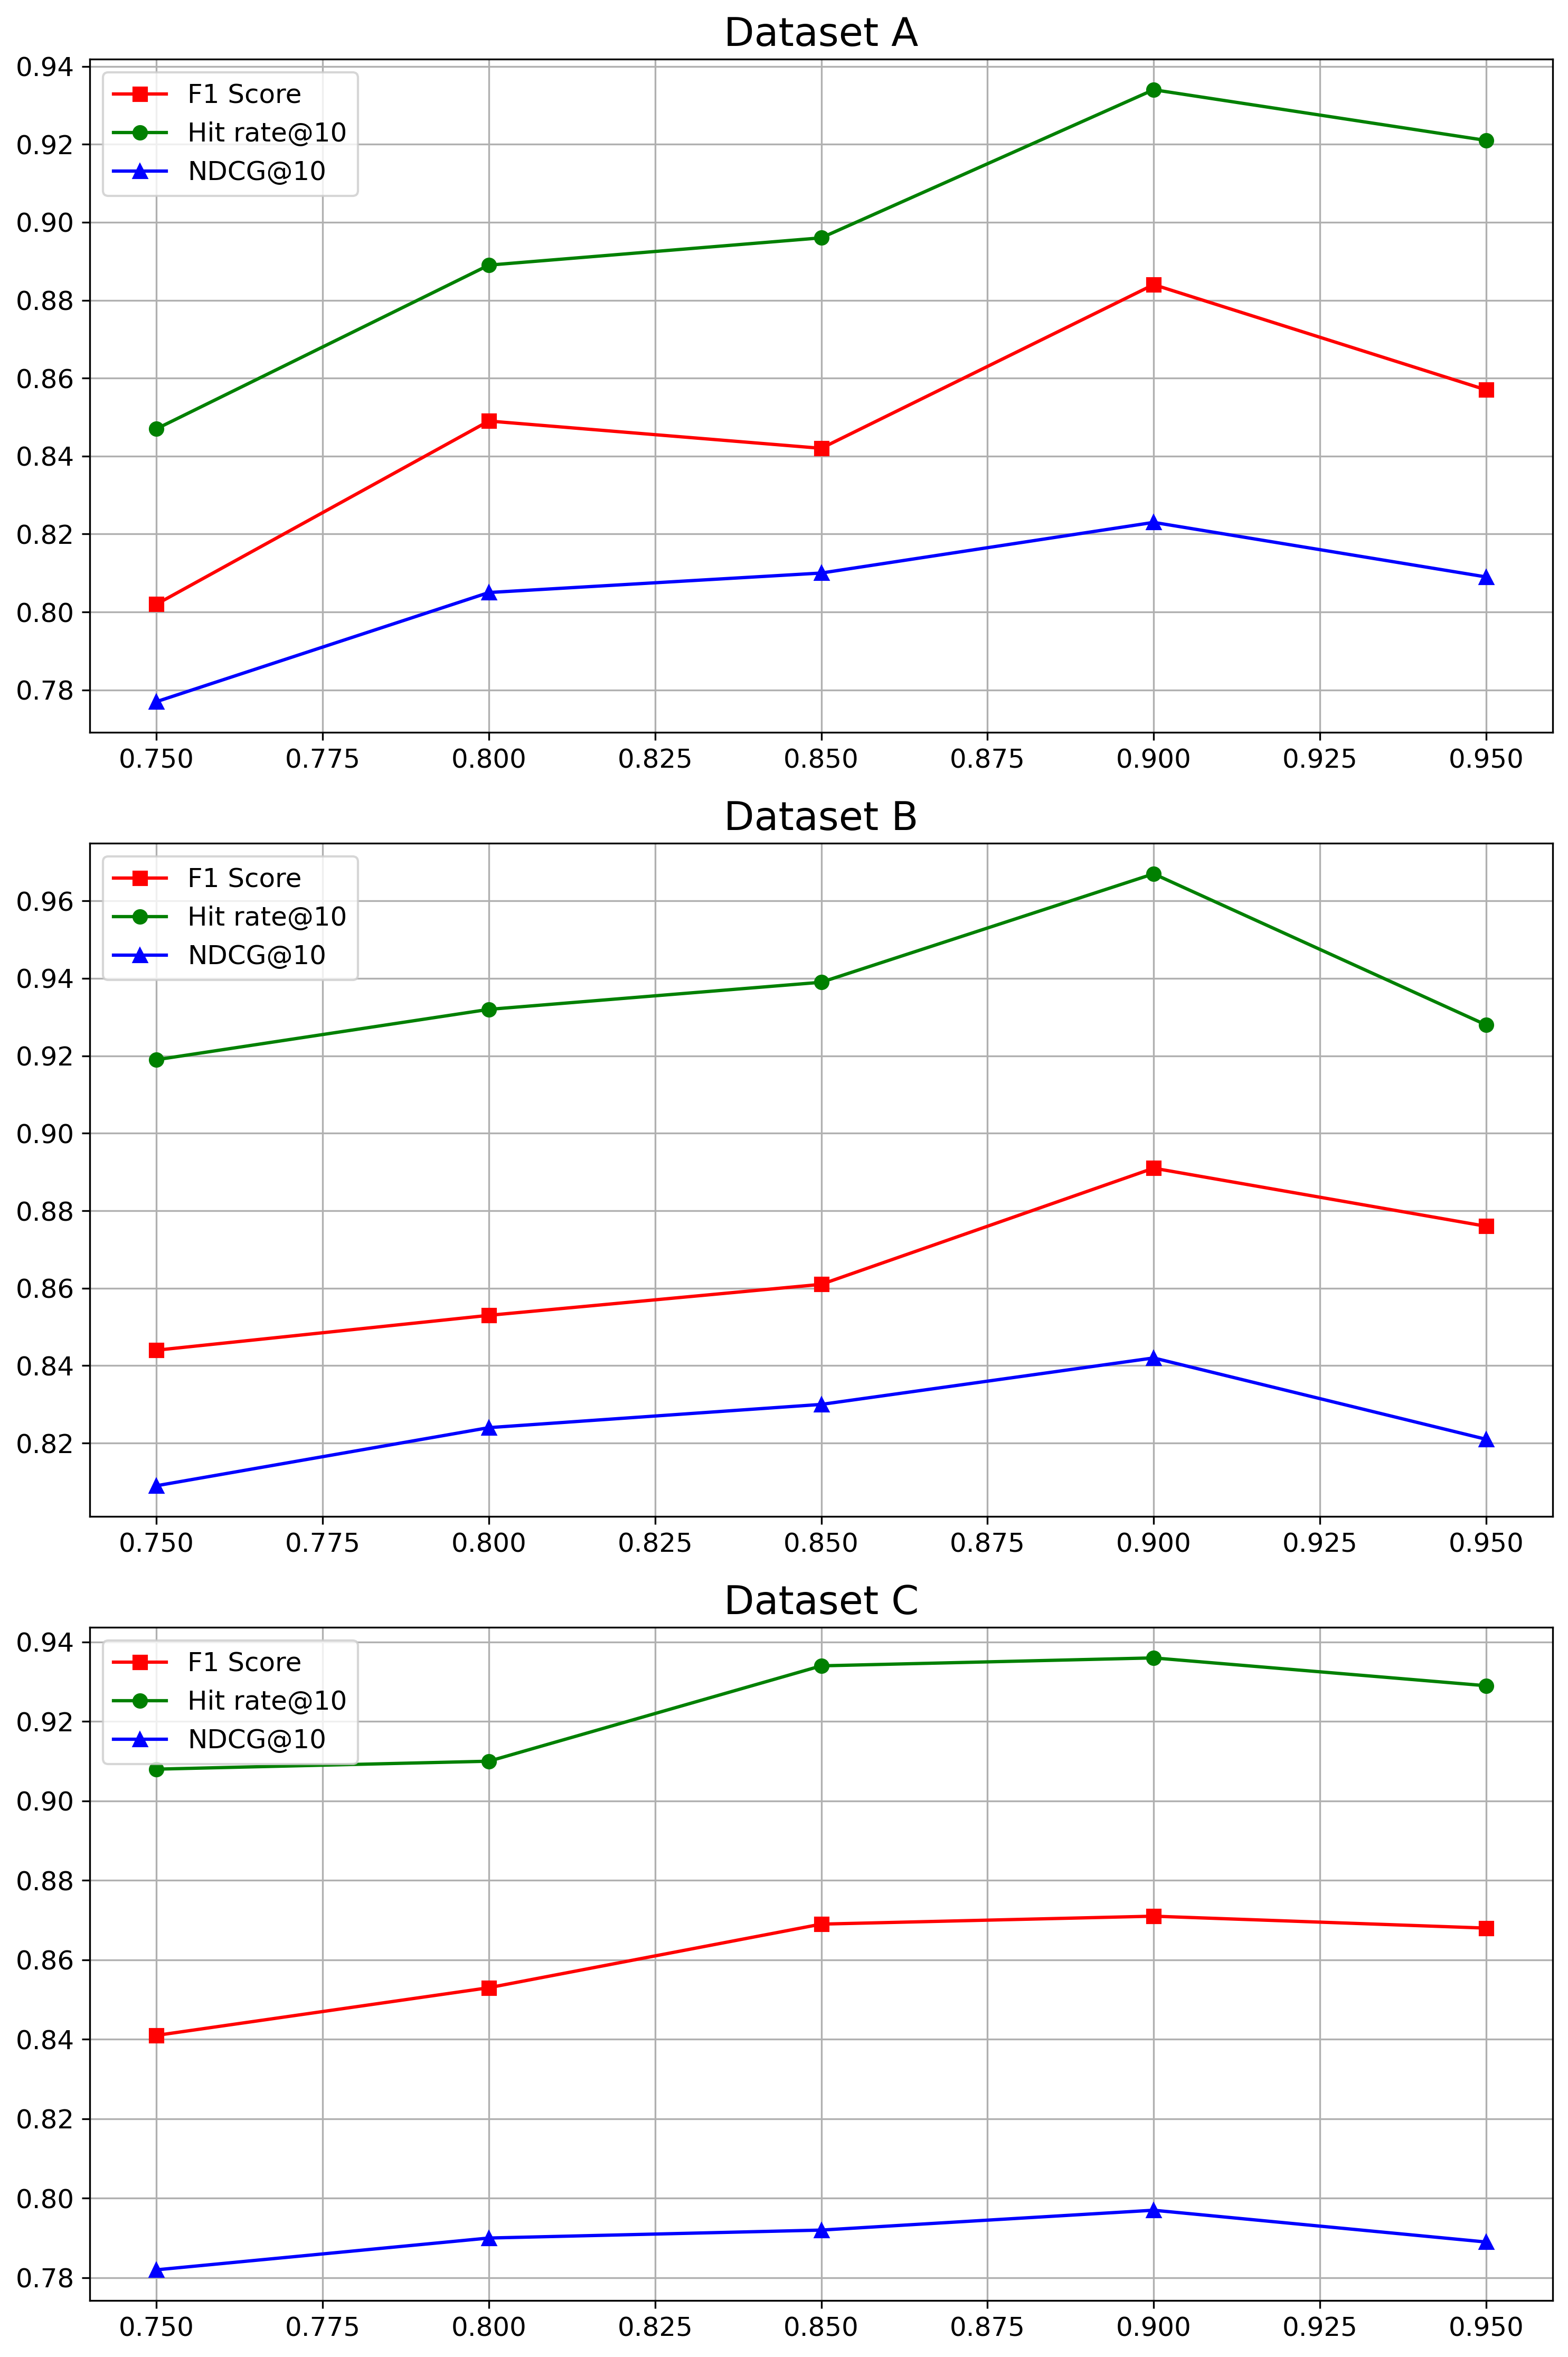
This document contains a detailed extraction of data from three line charts representing performance metrics (F1 Score, Hit rate@10, and NDCG@10) across three different datasets (Dataset A, Dataset B, and Dataset C).
## 1. General Chart Structure and Legend
All three charts share a common structure:
* **X-Axis:** Numerical values ranging from **0.750 to 0.950** with major ticks at intervals of 0.025.
* **Y-Axis:** Performance scores ranging from approximately **0.78 to 0.97**.
* **Legend (Located at top-left of each plot):**
* **Red Line with Square Markers ($\blacksquare$):** F1 Score
* **Green Line with Circle Markers ($\bullet$):** Hit rate@10
* **Blue Line with Triangle Markers ($\blacktriangle$):** NDCG@10
* **Grid:** A standard rectangular grid is present in all plots.
---
## 2. Dataset A Analysis
### Trend Verification
* **Hit rate@10 (Green):** Slopes upward steadily from 0.750 to 0.900, reaching a peak, then declines at 0.950.
* **F1 Score (Red):** Slopes upward to 0.800, dips slightly at 0.850, peaks at 0.900, and declines at 0.950.
* **NDCG@10 (Blue):** Slopes upward consistently from 0.750 to 0.900, then declines at 0.950.
### Data Table (Extracted Values)
| X-Value | F1 Score (Red) | Hit rate@10 (Green) | NDCG@10 (Blue) |
| :--- | :--- | :--- | :--- |
| **0.750** | ~0.802 | ~0.847 | ~0.777 |
| **0.800** | ~0.849 | ~0.889 | ~0.805 |
| **0.850** | ~0.842 | ~0.896 | ~0.810 |
| **0.900** | ~0.884 | ~0.934 | ~0.823 |
| **0.950** | ~0.857 | ~0.921 | ~0.809 |
---
## 3. Dataset B Analysis
### Trend Verification
* **Hit rate@10 (Green):** Shows a continuous upward slope from 0.750 to 0.900, followed by a sharp decline at 0.950.
* **F1 Score (Red):** Shows a steady, gradual upward slope from 0.750 to 0.900, followed by a decline at 0.950.
* **NDCG@10 (Blue):** Shows a steady upward slope from 0.750 to 0.900, followed by a decline at 0.950.
### Data Table (Extracted Values)
| X-Value | F1 Score (Red) | Hit rate@10 (Green) | NDCG@10 (Blue) |
| :--- | :--- | :--- | :--- |
| **0.750** | ~0.844 | ~0.919 | ~0.809 |
| **0.800** | ~0.853 | ~0.932 | ~0.824 |
| **0.850** | ~0.861 | ~0.939 | ~0.830 |
| **0.900** | ~0.891 | ~0.967 | ~0.842 |
| **0.950** | ~0.876 | ~0.928 | ~0.821 |
---
## 4. Dataset C Analysis
### Trend Verification
* **Hit rate@10 (Green):** Slopes upward from 0.750 to 0.850, plateaus/slightly increases to 0.900, then declines at 0.950.
* **F1 Score (Red):** Slopes upward from 0.750 to 0.850, plateaus to 0.900, then shows a very slight decline at 0.950.
* **NDCG@10 (Blue):** Slopes upward gradually from 0.750 to 0.900, then declines at 0.950.
### Data Table (Extracted Values)
| X-Value | F1 Score (Red) | Hit rate@10 (Green) | NDCG@10 (Blue) |
| :--- | :--- | :--- | :--- |
| **0.750** | ~0.841 | ~0.908 | ~0.782 |
| **0.800** | ~0.853 | ~0.910 | ~0.790 |
| **0.850** | ~0.869 | ~0.934 | ~0.792 |
| **0.900** | ~0.871 | ~0.936 | ~0.797 |
| **0.950** | ~0.868 | ~0.929 | ~0.789 |
---
## Summary of Findings
Across all three datasets, performance metrics generally peak at an **X-axis value of 0.900**. Dataset B shows the highest overall performance values, with Hit rate@10 reaching nearly 0.97. Dataset C exhibits the most stable (plateau-like) performance between 0.850 and 0.900 compared to the more pronounced peaks in Datasets A and B.