## Line Charts: Llama-3-8B and Llama-3-70B Performance
### Overview
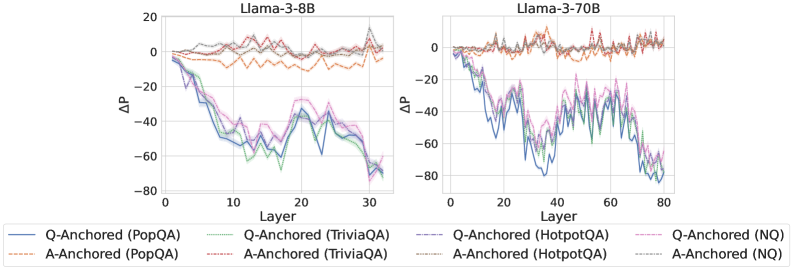
The image presents two line charts comparing the performance of Llama-3-8B and Llama-3-70B models across different layers. The charts depict the change in performance (ΔP) as a function of the layer number for various question-answering datasets (PopQA, TriviaQA, HotpotQA, and NQ), using both question-anchored (Q-Anchored) and answer-anchored (A-Anchored) approaches.
### Components/Axes
**Left Chart (Llama-3-8B):**
* **Title:** Llama-3-8B
* **X-axis:** Layer, with ticks at 0, 10, 20, and 30.
* **Y-axis:** ΔP, ranging from -80 to 20, with ticks at -80, -60, -40, -20, 0, and 20.
**Right Chart (Llama-3-70B):**
* **Title:** Llama-3-70B
* **X-axis:** Layer, with ticks at 0, 20, 40, 60, and 80.
* **Y-axis:** ΔP, ranging from -80 to 20, with ticks at -80, -60, -40, -20, 0, and 20.
**Legend (Located at the bottom of the image, spanning both charts):**
* **Q-Anchored (PopQA):** Solid blue line
* **A-Anchored (PopQA):** Dashed brown line
* **Q-Anchored (TriviaQA):** Dotted green line
* **A-Anchored (TriviaQA):** Dotted-dashed grey line
* **Q-Anchored (HotpotQA):** Dotted-dashed pink line
* **A-Anchored (HotpotQA):** Dashed orange line
* **Q-Anchored (NQ):** Dotted-dashed purple line
* **A-Anchored (NQ):** Dotted grey line
### Detailed Analysis
**Llama-3-8B:**
* **Q-Anchored (PopQA):** Starts at approximately 0 and decreases to around -70 by layer 30.
* **A-Anchored (PopQA):** Remains relatively stable around 0 throughout all layers.
* **Q-Anchored (TriviaQA):** Starts at approximately 0 and decreases to around -65 by layer 30.
* **A-Anchored (TriviaQA):** Remains relatively stable around 5 throughout all layers.
* **Q-Anchored (HotpotQA):** Starts at approximately 0 and decreases to around -70 by layer 30.
* **A-Anchored (HotpotQA):** Remains relatively stable around 0 throughout all layers.
* **Q-Anchored (NQ):** Starts at approximately 0 and decreases to around -40 by layer 30.
* **A-Anchored (NQ):** Remains relatively stable around 10 throughout all layers.
**Llama-3-70B:**
* **Q-Anchored (PopQA):** Starts at approximately 0 and decreases to around -75 by layer 80.
* **A-Anchored (PopQA):** Remains relatively stable around 0 throughout all layers.
* **Q-Anchored (TriviaQA):** Starts at approximately 0 and decreases to around -60 by layer 80.
* **A-Anchored (TriviaQA):** Remains relatively stable around 5 throughout all layers.
* **Q-Anchored (HotpotQA):** Starts at approximately 0 and decreases to around -70 by layer 80.
* **A-Anchored (HotpotQA):** Remains relatively stable around 0 throughout all layers.
* **Q-Anchored (NQ):** Starts at approximately 0 and decreases to around -50 by layer 80.
* **A-Anchored (NQ):** Remains relatively stable around 10 throughout all layers.
### Key Observations
* For both models, the Q-Anchored approach generally results in a decrease in ΔP as the layer number increases, indicating a decline in performance.
* The A-Anchored approach tends to maintain a relatively stable ΔP across all layers, suggesting a more consistent performance.
* The Llama-3-70B model has a longer x-axis (Layer), indicating it has more layers than the Llama-3-8B model.
* The trends for each dataset (PopQA, TriviaQA, HotpotQA, NQ) are similar across both models.
### Interpretation
The data suggests that using a question-anchored approach leads to a degradation in performance as the model processes deeper layers, while an answer-anchored approach maintains a more consistent level of performance. This could indicate that the model's ability to effectively utilize information from the question diminishes in later layers, whereas the answer-related information remains more stable. The Llama-3-70B model, with its increased number of layers, exhibits similar trends to the Llama-3-8B model, suggesting that the observed behavior is consistent across different model sizes. The consistent performance of A-Anchored methods could be due to the model focusing on answer-relevant features throughout the layers, mitigating the degradation seen in Q-Anchored methods.