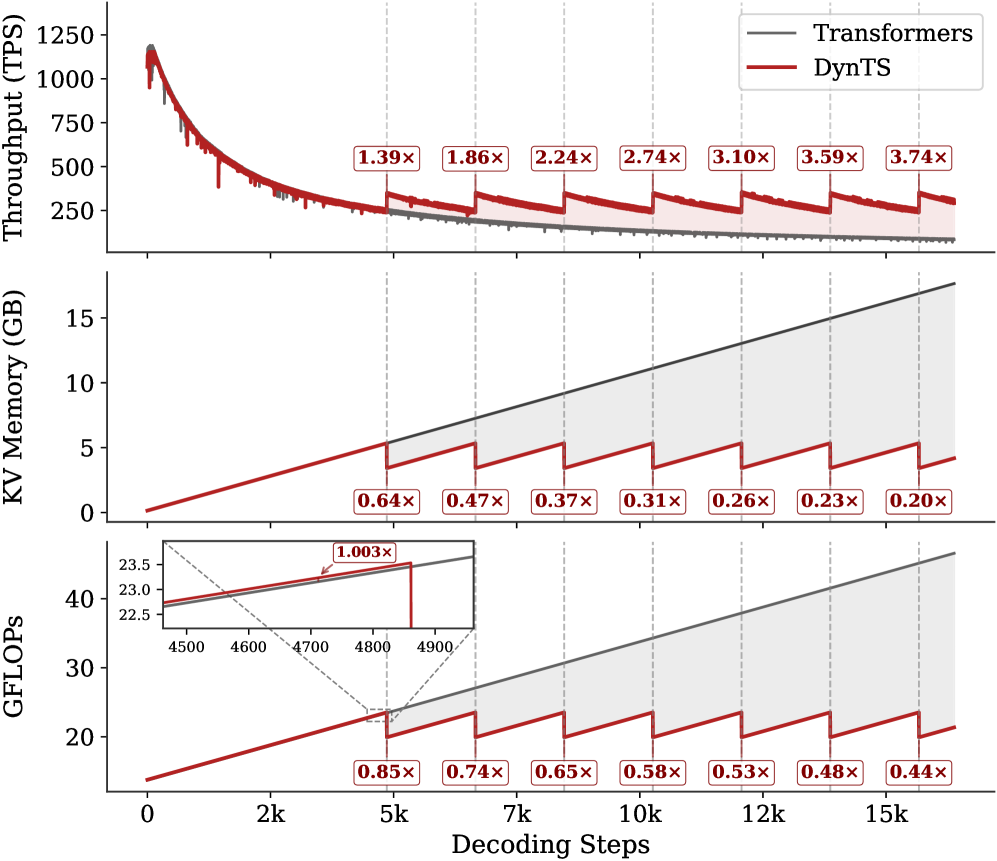
## Chart Type: Performance Comparison of Transformers and DynTS
### Overview
The image presents three line charts comparing the performance of "Transformers" and "DynTS" across different decoding steps. The charts depict Throughput (TPS), KV Memory (GB), and GFLOPS as a function of decoding steps, ranging from 0 to 15k. The performance of DynTS is shown relative to Transformers with ratio labels at specific decoding steps.
### Components/Axes
* **X-axis (all charts):** Decoding Steps, ranging from 0 to 15k with tick marks at 0, 2k, 5k, 7k, 10k, 12k, and 15k.
* **Top Chart:**
* Y-axis: Throughput (TPS), ranging from 250 to 1250 with tick marks at 250, 500, 750, 1000, and 1250.
* Legend:
* Transformers (Gray line)
* DynTS (Red line)
* **Middle Chart:**
* Y-axis: KV Memory (GB), ranging from 0 to 15 with tick marks at 0, 5, 10, and 15.
* Legend: (Same as Top Chart)
* Transformers (Gray line)
* DynTS (Red line)
* **Bottom Chart:**
* Y-axis: GFLOPS, ranging from 20 to 40 with tick marks at 20, 30, and 40. An inset plot shows a zoomed-in view of the GFLOPS values between 22.5 and 23.5 for decoding steps 4500 to 4900.
* Legend: (Same as Top Chart)
* Transformers (Gray line)
* DynTS (Red line)
### Detailed Analysis
* **Top Chart (Throughput):**
* **Transformers (Gray):** The throughput starts high (approximately 1200 TPS) and rapidly decreases, then plateaus at a low value (approximately 50 TPS).
* At 5k Decoding Steps: ~50 TPS
* At 15k Decoding Steps: ~50 TPS
* **DynTS (Red):** The throughput starts high (approximately 1200 TPS) and rapidly decreases, then plateaus at a higher value than Transformers. The DynTS line shows periodic drops in throughput at intervals of approximately 2k decoding steps.
* At 5k Decoding Steps: ~275 TPS
* At 7k Decoding Steps: ~200 TPS
* At 10k Decoding Steps: ~150 TPS
* At 12k Decoding Steps: ~125 TPS
* At 15k Decoding Steps: ~100 TPS
* Ratio labels above the DynTS line indicate the multiplicative factor of DynTS throughput compared to Transformers at specific decoding steps:
* 2k Decoding Steps: 1.39x
* 5k Decoding Steps: 1.86x
* 7k Decoding Steps: 2.24x
* 9k Decoding Steps: 2.74x
* 11k Decoding Steps: 3.10x
* 13k Decoding Steps: 3.59x
* 15k Decoding Steps: 3.74x
* **Middle Chart (KV Memory):**
* **Transformers (Gray):** The KV Memory increases linearly with decoding steps, reaching approximately 17 GB at 15k steps.
* At 5k Decoding Steps: ~5.7 GB
* At 10k Decoding Steps: ~11.4 GB
* At 15k Decoding Steps: ~17 GB
* **DynTS (Red):** The KV Memory increases linearly but with periodic drops at intervals of approximately 2k decoding steps. The slope of the DynTS line is less steep than the Transformers line.
* At 5k Decoding Steps: ~3.6 GB
* At 7k Decoding Steps: ~3.2 GB
* At 10k Decoding Steps: ~3.0 GB
* At 12k Decoding Steps: ~2.8 GB
* At 15k Decoding Steps: ~2.6 GB
* Ratio labels below the DynTS line indicate the multiplicative factor of DynTS KV Memory compared to Transformers at specific decoding steps:
* 5k Decoding Steps: 0.64x
* 7k Decoding Steps: 0.47x
* 9k Decoding Steps: 0.37x
* 11k Decoding Steps: 0.31x
* 13k Decoding Steps: 0.26x
* 15k Decoding Steps: 0.23x
* 17k Decoding Steps: 0.20x
* **Bottom Chart (GFLOPS):**
* **Transformers (Gray):** The GFLOPS increases linearly with decoding steps, reaching approximately 38 GFLOPS at 15k steps.
* At 5k Decoding Steps: ~28.5 GFLOPS
* At 10k Decoding Steps: ~33 GFLOPS
* At 15k Decoding Steps: ~38 GFLOPS
* **DynTS (Red):** The GFLOPS increases linearly but with periodic drops at intervals of approximately 2k decoding steps. The slope of the DynTS line is less steep than the Transformers line.
* At 5k Decoding Steps: ~24 GFLOPS
* At 7k Decoding Steps: ~23 GFLOPS
* At 10k Decoding Steps: ~22 GFLOPS
* At 12k Decoding Steps: ~21 GFLOPS
* At 15k Decoding Steps: ~20 GFLOPS
* Ratio labels below the DynTS line indicate the multiplicative factor of DynTS GFLOPS compared to Transformers at specific decoding steps:
* 2k Decoding Steps: 0.85x
* 5k Decoding Steps: 0.74x
* 7k Decoding Steps: 0.65x
* 9k Decoding Steps: 0.58x
* 11k Decoding Steps: 0.53x
* 13k Decoding Steps: 0.48x
* 15k Decoding Steps: 0.44x
* Inset plot shows that at around 4750 decoding steps, the DynTS GFLOPS is 1.003x that of Transformers.
### Key Observations
* DynTS maintains a higher throughput than Transformers as decoding steps increase.
* DynTS uses significantly less KV Memory than Transformers.
* DynTS uses fewer GFLOPS than Transformers.
* The periodic drops in DynTS performance (throughput, KV memory, and GFLOPS) occur at regular intervals of approximately 2k decoding steps.
### Interpretation
The charts demonstrate that DynTS offers a more efficient alternative to Transformers, particularly in terms of KV Memory usage and GFLOPS. While the initial throughput is similar, DynTS maintains a higher throughput as decoding progresses. The periodic drops in DynTS performance likely correspond to a memory management or optimization process that occurs at regular intervals. The ratio labels quantify the performance gains of DynTS relative to Transformers, highlighting the increasing advantage of DynTS as decoding steps increase. The inset plot in the GFLOPS chart shows a point where DynTS is nearly equivalent to Transformers, suggesting a specific operational point where the two models have similar computational costs.