TECHNICAL ASSET FINGERPRINT
d8b5e0c4b2fff55bfdcb5a42
Click to view fullscreen
Press ESC or click to close
FOUND IN PAPERS
EXPERT: healer-alpha-free VERSION 1
RUNTIME: free/openrouter/healer-alpha
INTEL_VERIFIED
\n
## Multi-Panel Performance Comparison Chart: Transformers vs. DynTS
### Overview
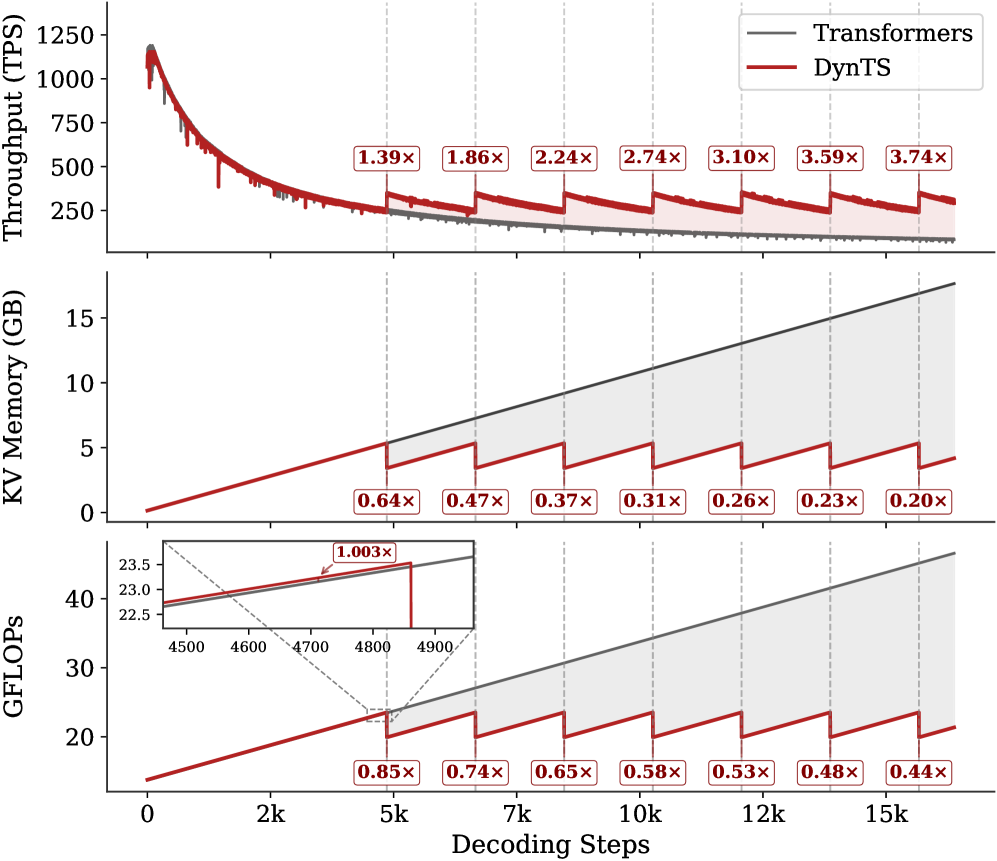
The image is a three-panel vertical chart comparing the performance of a standard "Transformers" model (gray line) against a proposed "DynTS" model (red line) across three key metrics as a function of decoding steps. The chart demonstrates that DynTS achieves significant improvements in throughput and reductions in memory and computational cost, particularly as the sequence length (decoding steps) increases. The performance gains are presented as multipliers relative to the baseline Transformers model.
### Components/Axes
* **Common X-Axis (Bottom):** "Decoding Steps". The scale is linear, marked at 0, 2k, 5k, 7k, 10k, 12k, and 15k steps.
* **Legend (Top-Right of Top Panel):** A box containing two entries:
* A gray line labeled "Transformers".
* A red line labeled "DynTS".
* **Panel 1 (Top):**
* **Y-Axis Label (Left):** "Throughput (TPS)" - Transactions Per Second.
* **Y-Axis Scale:** Linear, from 0 to 1250, with major ticks at 250, 500, 750, 1000, 1250.
* **Data Series:** Two lines showing throughput decay as decoding steps increase.
* **Annotations:** Seven red boxes with white text, placed above the red line at specific intervals, showing the throughput multiplier of DynTS vs. Transformers: `1.39×`, `1.86×`, `2.24×`, `2.74×`, `3.10×`, `3.59×`, `3.74×`.
* **Panel 2 (Middle):**
* **Y-Axis Label (Left):** "KV Memory (GB)" - Key-Value cache memory in Gigabytes.
* **Y-Axis Scale:** Linear, from 0 to 15, with major ticks at 0, 5, 10, 15.
* **Data Series:** Two lines showing memory usage growth.
* **Annotations:** Seven red boxes with white text, placed below the red line, showing the memory usage multiplier of DynTS vs. Transformers: `0.64×`, `0.47×`, `0.37×`, `0.31×`, `0.26×`, `0.23×`, `0.20×`.
* **Panel 3 (Bottom):**
* **Y-Axis Label (Left):** "GFLOPs" - Giga Floating-Point Operations.
* **Y-Axis Scale:** Linear, from 20 to 40, with major ticks at 20, 30, 40.
* **Data Series:** Two lines showing computational cost growth.
* **Annotations:** Seven red boxes with white text, placed below the red line, showing the GFLOPs multiplier of DynTS vs. Transformers: `0.85×`, `0.74×`, `0.65×`, `0.58×`, `0.53×`, `0.48×`, `0.44×`.
* **Inset Zoom (Top-Left of Panel):** A small zoomed-in view of the region around 4500-4900 decoding steps. It shows the red and gray lines nearly overlapping, with a red annotation box stating `1.003×`, indicating near-identical computational cost at that specific, early stage.
### Detailed Analysis
**Panel 1: Throughput (TPS)**
* **Trend Verification:** Both lines show a steep, near-identical decline in throughput from ~1200 TPS at 0 steps to ~250 TPS at 5k steps. After 5k steps, the Transformers line continues a smooth, gradual decline. The DynTS line exhibits a distinctive **sawtooth pattern**: it periodically drops sharply and then recovers, but each recovery peak is higher than the previous trough, and the overall trend remains above the Transformers line.
* **Data Points (Multipliers):** The annotated multipliers quantify DynTS's increasing advantage: `1.39×` at ~5k steps, `1.86×` at ~7k, `2.24×` at ~10k, `2.74×` at ~12k, `3.10×` at ~13k, `3.59×` at ~14k, and `3.74×` at ~15k steps.
**Panel 2: KV Memory (GB)**
* **Trend Verification:** The Transformers line (gray) shows a **linear, steady increase** in memory usage, growing from near 0 GB to approximately 17 GB at 15k steps. The DynTS line (red) also increases linearly but at a much shallower slope. It also features a **sawtooth pattern**, where memory usage is periodically reset to a lower value before climbing again.
* **Data Points (Multipliers):** The memory reduction factor of DynTS improves dramatically with sequence length: `0.64×` at ~5k steps, `0.47×` at ~7k, `0.37×` at ~10k, `0.31×` at ~12k, `0.26×` at ~13k, `0.23×` at ~14k, and `0.20×` at ~15k steps. At 15k steps, DynTS uses only about 20% of the memory required by Transformers.
**Panel 3: GFLOPs**
* **Trend Verification:** Similar to memory, the Transformers line shows a **linear increase** in computational cost, rising from below 20 GFLOPs to over 40 GFLOPs. The DynTS line increases at a lower rate and also displays the characteristic **sawtooth pattern** of periodic reduction.
* **Data Points (Multipliers):** The computational savings grow over time: `0.85×` at ~5k steps, `0.74×` at ~7k, `0.65×` at ~10k, `0.58×` at ~12k, `0.53×` at ~13k, `0.48×` at ~14k, and `0.44×` at ~15k steps.
* **Inset Detail:** The inset confirms that for very short sequences (around 4.7k steps), the computational cost of DynTS is virtually identical to Transformers (`1.003×`), with the lines overlapping. The significant savings accrue for longer sequences.
### Key Observations
1. **Sawtooth Pattern:** The most striking visual feature is the periodic sawtooth pattern in all three DynTS metrics. This suggests a dynamic, periodic optimization or reset mechanism that becomes active after a certain sequence length (~5k steps).
2. **Diverging Performance:** The performance gap between DynTS and Transformers widens consistently as decoding steps increase. DynTS's advantages are not static but scale with sequence length.
3. **Metric Correlation:** Improvements in throughput, memory, and computation are correlated. The points where memory and GFLOPs are reset (the troughs of the sawtooth) correspond to points where throughput sees a relative boost (the peaks of its sawtooth).
4. **Early-Stage Parity:** The inset in the GFLOPs panel highlights that for short sequences, the overhead of DynTS's mechanism may negate its benefits, resulting in near-identical cost to the baseline.
### Interpretation
This chart presents compelling evidence for the efficiency of the "DynTS" method, likely a dynamic transformer variant, for long-sequence decoding tasks. The data suggests DynTS implements a **periodic compression or eviction strategy** for the Key-Value (KV) cache, which is the primary source of memory and computational growth in standard transformers.
* **The Sawtooth as Evidence of a Reset:** The periodic drops in memory and GFLOPs (and corresponding throughput adjustments) are the direct visual signature of this cache management policy. Each "tooth" represents a cycle of cache growth followed by a compression/eviction event.
* **Scalability:** The core message is scalability. While standard Transformers suffer from linearly increasing resource demands, DynTS mitigates this. The `0.20×` memory multiplier at 15k steps is particularly significant, as KV cache memory is often the primary bottleneck for serving long-context models.
* **Trade-off and Sweet Spot:** The throughput graph shows that while DynTS always outperforms Transformers after the initial phase, the *rate* of improvement changes. The most dramatic relative gains (`3.74×`) occur at the longest measured sequences, indicating DynTS is specifically designed for and excels in long-context scenarios. The inset warns that for short contexts, the added complexity may not be worthwhile.
* **Practical Implication:** For applications requiring generation of very long sequences (e.g., document drafting, extended dialogue, code generation), DynTS promises substantially higher throughput and drastically lower hardware requirements (memory and compute), making such tasks more feasible and cost-effective.
DECODING INTELLIGENCE...