## Image Comparison: Ground Truth vs. Predicted Room Acoustics
### Overview
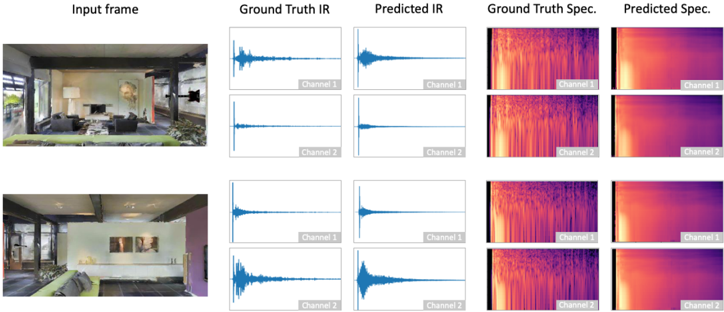
The image presents a visual comparison between "Ground Truth" (actual) and "Predicted" room acoustics data. It includes input frames (images of rooms), impulse responses (IR), and spectrograms (Spec.) for two different channels. The comparison aims to assess the accuracy of a prediction model in simulating room acoustics.
### Components/Axes
* **Titles (Top Row):**
* Input frame
* Ground Truth IR
* Predicted IR
* Ground Truth Spec.
* Predicted Spec.
* **Channel Labels:** Each IR and Spectrogram plot is labeled with either "Channel 1" or "Channel 2" in a gray box at the bottom-right corner.
* **Input Frames:** These are images of two different rooms. The first room appears to be a living room with a fireplace, while the second room seems to be a more minimalist space with artwork on the wall.
* **Impulse Response (IR) Plots:** These plots show the amplitude of the sound over time. The x-axis represents time, and the y-axis represents amplitude.
* **Spectrogram (Spec) Plots:** These plots show the frequency content of the sound over time. The x-axis represents time, and the y-axis represents frequency. The color intensity represents the amplitude of each frequency component.
### Detailed Analysis
**Row 1: First Room (Living Room)**
* **Input Frame:** A living room scene with a fireplace, seating area, and artwork.
* **Ground Truth IR:**
* Channel 1: A sharp initial peak followed by a decaying oscillation.
* Channel 2: Similar to Channel 1, with a sharp initial peak and decaying oscillation.
* **Predicted IR:**
* Channel 1: Visually similar to the Ground Truth IR for Channel 1.
* Channel 2: Visually similar to the Ground Truth IR for Channel 2.
* **Ground Truth Spec:**
* Channel 1: Shows a broad range of frequencies with varying intensities over time. The intensity is higher at lower frequencies.
* Channel 2: Similar to Channel 1, with a broad range of frequencies and higher intensity at lower frequencies.
* **Predicted Spec:**
* Channel 1: Appears less detailed than the Ground Truth Spec, with a smoother representation of frequency content.
* Channel 2: Similar to Channel 1, less detailed than the Ground Truth Spec.
**Row 2: Second Room (Minimalist Room)**
* **Input Frame:** A minimalist room with artwork on the wall and a seating area.
* **Ground Truth IR:**
* Channel 1: A sharp initial peak followed by a decaying oscillation.
* Channel 2: Similar to Channel 1, with a sharp initial peak and decaying oscillation.
* **Predicted IR:**
* Channel 1: Visually similar to the Ground Truth IR for Channel 1.
* Channel 2: Visually similar to the Ground Truth IR for Channel 2.
* **Ground Truth Spec:**
* Channel 1: Shows a broad range of frequencies with varying intensities over time. The intensity is higher at lower frequencies.
* Channel 2: Similar to Channel 1, with a broad range of frequencies and higher intensity at lower frequencies.
* **Predicted Spec:**
* Channel 1: Appears less detailed than the Ground Truth Spec, with a smoother representation of frequency content.
* Channel 2: Similar to Channel 1, less detailed than the Ground Truth Spec.
### Key Observations
* The predicted impulse responses (IR) appear to closely match the ground truth IRs for both rooms and both channels.
* The predicted spectrograms (Spec) are less detailed than the ground truth spectrograms, suggesting that the prediction model may be simplifying the frequency content of the room acoustics.
* Both ground truth spectrograms show higher intensity at lower frequencies.
### Interpretation
The data suggests that the prediction model is reasonably accurate in predicting the overall impulse response of the rooms. However, the model seems to struggle with capturing the finer details of the frequency content, as evidenced by the less detailed predicted spectrograms. This could be due to limitations in the model's architecture, training data, or the complexity of accurately simulating room acoustics. The model seems to perform consistently across both rooms and channels. The higher intensity at lower frequencies in the spectrograms is a common characteristic of room acoustics, indicating that lower frequencies tend to persist longer in enclosed spaces.