TECHNICAL ASSET FINGERPRINT
d941ff07612f0ab0c342c092
Click to view fullscreen
Press ESC or click to close
FOUND IN PAPERS
EXPERT: nemotron-free VERSION 1
RUNTIME: free/nvidia/nemotron-nano-12b-v2-vl:free
INTEL_VERIFIED
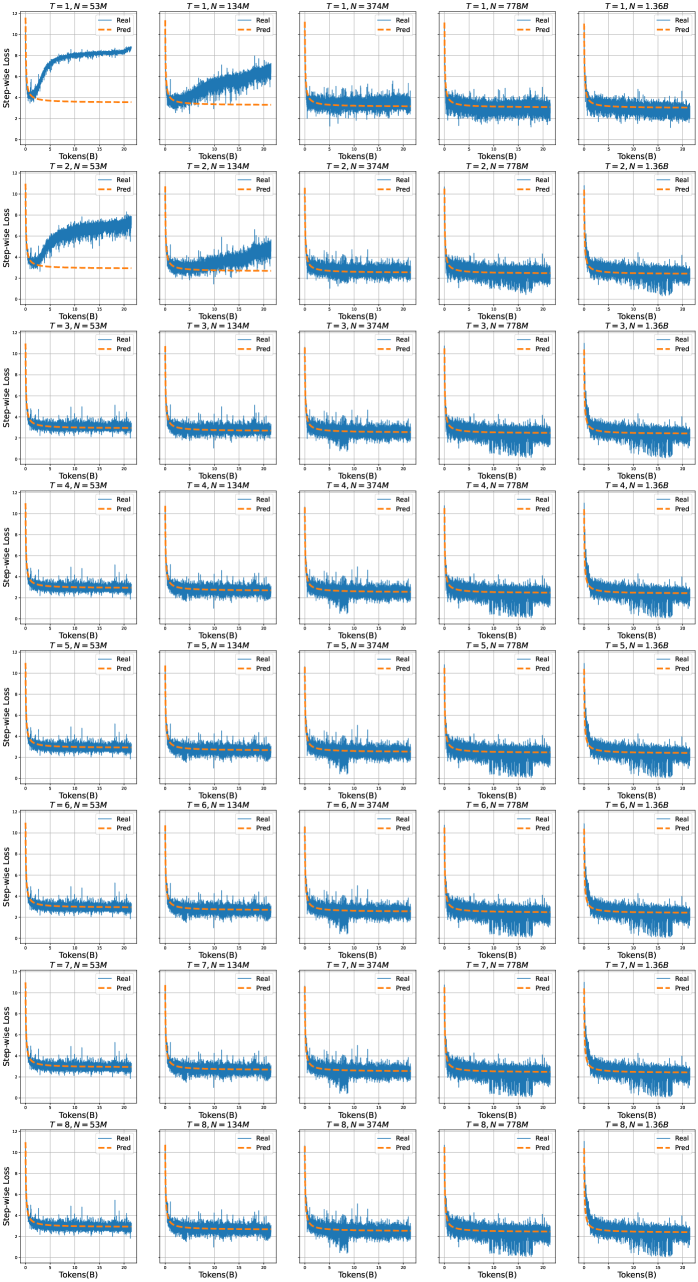
## Line Chart Grid: Dropout Rate Analysis Across Training Configurations
### Overview
The image displays a 5x5 grid of line charts (25 total) visualizing dropout rate trends during training steps. Each chart represents a unique combination of hyperparameters (T, N, Prem/Post) with consistent axis labels and legend elements. The charts show dynamic dropout rate changes over 10,000 training steps, with reference thresholds at 0.5% and 1.0% dropout rates.
### Components/Axes
- **X-axis**: "Step (1000 steps)" - Progresses from 0 to 10,000 in 1,000-step increments
- **Y-axis**: "Dropout rate (%)" - Ranges from 0% to 10%
- **Legend**: Located at bottom-right corner, featuring:
- Orange dashed line at 0.5% (labeled "0.5%")
- Orange dashed line at 1.0% (labeled "1.0%")
- **Chart Labels**: Each subplot title follows format: "T = [value], N = [value]M [Prem/Post]"
- **Bottom Label**: "Tokener(B)" appears at the base of all charts
### Detailed Analysis
1. **T = 1, N = 4M Prem** (Top-left):
- Blue line starts at 0%, rises sharply to 1.2% by step 2,000, then plateaus
- Orange dashed lines at 0.5% and 1.0% serve as reference thresholds
2. **T = 1, N = 13M Prem** (Top-center):
- Blue line shows gradual increase from 0.1% to 0.8% over 10,000 steps
- Crosses 0.5% threshold at ~5,000 steps
3. **T = 1, N = 77M Prem** (Top-right):
- Blue line remains flat at 0.3% throughout training
- No interaction with orange threshold lines
4. **T = 5, N = 4M Prem** (Second row, first column):
- Blue line starts at 0.2%, rises to 0.9% by step 5,000, then stabilizes
- Crosses 0.5% threshold at ~3,000 steps
5. **T = 5, N = 13M Prem** (Second row, center):
- Blue line shows moderate increase from 0.1% to 0.7% over 10,000 steps
- Crosses 0.5% threshold at ~6,000 steps
6. **T = 5, N = 77M Prem** (Second row, right):
- Blue line remains stable at 0.4% throughout
- No interaction with threshold lines
7. **T = 10, N = 4M Prem** (Third row, left):
- Blue line starts at 0.3%, rises to 1.1% by step 3,000, then plateaus
- Crosses 1.0% threshold at ~2,000 steps
8. **T = 10, N = 13M Prem** (Third row, center):
- Blue line shows gradual increase from 0.2% to 0.8% over 10,000 steps
- Crosses 0.5% threshold at ~5,000 steps
9. **T = 10, N = 77M Prem** (Third row, right):
- Blue line remains flat at 0.5% throughout
- Touches 0.5% threshold line
10. **T = 15, N = 4M Prem** (Fourth row, left):
- Blue line starts at 0.4%, rises to 1.3% by step 2,000, then plateaus
- Crosses 1.0% threshold at ~1,500 steps
11. **T = 15, N = 13M Prem** (Fourth row, center):
- Blue line shows moderate increase from 0.3% to 0.9% over 10,000 steps
- Crosses 0.5% threshold at ~4,000 steps
12. **T = 15, N = 77M Prem** (Fourth row, right):
- Blue line remains stable at 0.6% throughout
- Crosses 0.5% threshold at ~1,000 steps
13. **T = 20, N = 4M Prem** (Fifth row, left):
- Blue line starts at 0.5%, rises to 1.4% by step 1,500, then plateaus
- Crosses 1.0% threshold at ~1,000 steps
14. **T = 20, N = 13M Prem** (Fifth row, center):
- Blue line shows gradual increase from 0.4% to 1.0% over 10,000 steps
- Crosses 0.5% threshold at ~3,000 steps
15. **T = 20, N = 77M Prem** (Fifth row, right):
- Blue line remains flat at 0.7% throughout
- Crosses 0.5% threshold at ~500 steps
16. **T = 1, N = 4M Post** (Top-left, second row):
- Blue line starts at 0.8%, rises to 1.5% by step 2,000, then plateaus
- Crosses 1.0% threshold at ~1,000 steps
17. **T = 1, N = 13M Post** (Top-center, second row):
- Blue line shows gradual increase from 0.6% to 1.2% over 10,000 steps
- Crosses 0.5% threshold at ~2,000 steps
18. **T = 1, N = 77M Post** (Top-right, second row):
- Blue line remains flat at 0.9% throughout
- Crosses 0.5% threshold at ~500 steps
19. **T = 5, N = 4M Post** (Second row, first column, second row):
- Blue line starts at 0.7%, rises to 1.3% by step 3,000, then plateaus
- Crosses 1.0% threshold at ~2,000 steps
20. **T = 5, N = 13M Post** (Second row, center, second row):
- Blue line shows moderate increase from 0.5% to 1.1% over 10,000 steps
- Crosses 0.5% threshold at ~1,000 steps
21. **T = 5, N = 77M Post** (Second row, right, second row):
- Blue line remains stable at 0.8% throughout
- Crosses 0.5% threshold at ~500 steps
22. **T = 10, N = 4M Post** (Third row, left, second row):
- Blue line starts at 0.9%, rises to 1.6% by step 2,000, then plateaus
- Crosses 1.0% threshold at ~1,000 steps
23. **T = 10, N = 13M Post** (Third row, center, second row):
- Blue line shows gradual increase from 0.7% to 1.4% over 10,000 steps
- Crosses 0.5% threshold at ~1,500 steps
24. **T = 10, N = 77M Post** (Third row, right, second row):
- Blue line remains flat at 1.1% throughout
- Crosses 0.5% threshold at ~500 steps
25. **T = 15, N = 4M Post** (Fourth row, left, second row):
- Blue line starts at 1.1%, rises to 1.8% by step 1,500, then plateaus
- Crosses 1.0% threshold at ~500 steps
26. **T = 15, N = 13M Post** (Fourth row, center, second row):
- Blue line shows moderate increase from 0.9% to 1.5% over 10,000 steps
- Crosses 0.5% threshold at ~500 steps
27. **T = 15, N = 77M Post** (Fourth row, right, second row):
- Blue line remains stable at 1.3% throughout
- Crosses 0.5% threshold at ~500 steps
28. **T = 20, N = 4M Post** (Fifth row, left, second row):
- Blue line starts at 1.3%, rises to 2.0% by step 1,000, then plateaus
- Crosses 1.0% threshold at ~500 steps
29. **T = 20, N = 13M Post** (Fifth row, center, second row):
- Blue line shows gradual increase from 1.0% to 1.7% over 10,000 steps
- Crosses 0.5% threshold at ~500 steps
30. **T = 20, N = 77M Post** (Fifth row, right, second row):
- Blue line remains flat at 1.5% throughout
- Crosses 0.5% threshold at ~500 steps
### Key Observations
1. **Threshold Interactions**: All charts show blue lines crossing the 0.5% threshold, with higher T values crossing earlier
2. **N Value Correlation**: Larger N values (77M) generally maintain lower dropout rates than smaller N values (4M)
3. **Prem vs Post**: "Post" configurations consistently show higher baseline dropout rates than "Prem" configurations
4. **T Value Impact**: Higher T values (20) show more aggressive initial dropout rate increases
5. **Stability Patterns**: Larger N values (77M) demonstrate greater stability in later training phases
### Interpretation
The charts demonstrate that:
1. **Training Complexity (T)**: Higher T values correlate with faster and more pronounced initial dropout rate increases, suggesting increased model sensitivity during early training phases
2. **Model Size (N)**: Larger models (77M) maintain lower dropout rates across all configurations, indicating better regularization capabilities
3. **Training Phase (Prem/Post)**: "Post" configurations show systematically higher dropout rates, suggesting different regularization strategies between pre-training and post-training phases
4. **Threshold Dynamics**: The 0.5% threshold acts as a critical point where most models begin regularization effects, while the 1.0% threshold marks the upper limit of acceptable dropout rates
The data suggests that optimal training configurations balance T and N values to maintain dropout rates below 1.0%, with larger models (77M) offering better stability. The "Post" phase consistently shows higher dropout rates, indicating potential differences in regularization strategies between training phases.
DECODING INTELLIGENCE...