## Line Charts: Best-of-N Performance on AIME '24 and MATH-500
### Overview
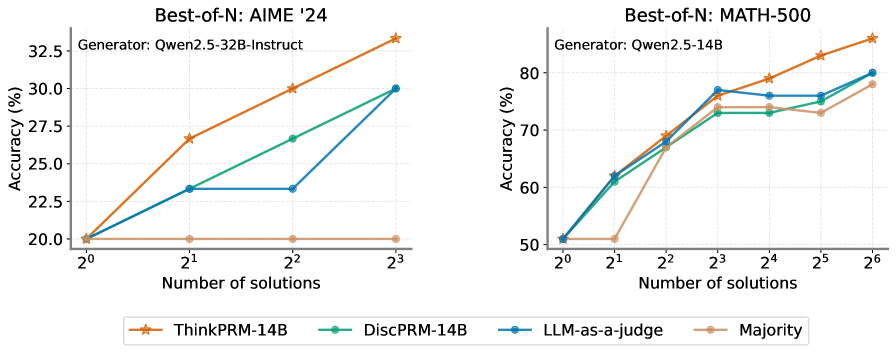
The image contains two side-by-side line charts comparing the performance of different methods for generating solutions to mathematical problems. The charts plot "Accuracy (%)" against the "Number of solutions" (N) on a logarithmic scale (base 2). The left chart evaluates performance on the "AIME '24" dataset using the "Qwen2.5-32B-Instruct" generator. The right chart evaluates performance on the "MATH-500" dataset using the "Qwen2.5-14B" generator. Four methods are compared in each chart.
### Components/Axes
**Titles & Subtitles:**
* **Left Chart Title:** `Best-of-N: AIME '24`
* **Left Chart Subtitle:** `Generator: Qwen2.5-32B-Instruct`
* **Right Chart Title:** `Best-of-N: MATH-500`
* **Right Chart Subtitle:** `Generator: Qwen2.5-14B`
**Axes:**
* **X-Axis (Both Charts):** Label: `Number of solutions`. Scale: Logarithmic (base 2). Ticks: `2^0`, `2^1`, `2^2`, `2^3` (left chart); `2^0`, `2^1`, `2^2`, `2^3`, `2^4`, `2^5`, `2^6` (right chart).
* **Y-Axis (Left Chart):** Label: `Accuracy (%)`. Scale: Linear. Ticks: `20.0`, `22.5`, `25.0`, `27.5`, `30.0`, `32.5`.
* **Y-Axis (Right Chart):** Label: `Accuracy (%)`. Scale: Linear. Ticks: `50`, `60`, `70`, `80`.
**Legend (Bottom Center, spanning both charts):**
* `ThinkPRM-14B`: Orange line with star markers.
* `DiscPRM-14B`: Teal line with circle markers.
* `LLM-as-a-judge`: Blue line with circle markers.
* `Majority`: Tan/light brown line with circle markers.
### Detailed Analysis
**Left Chart: AIME '24 (Generator: Qwen2.5-32B-Instruct)**
* **ThinkPRM-14B (Orange, Stars):** Shows a strong, consistent upward trend. Starts at ~20.0% (2^0), rises to ~26.5% (2^1), ~30.0% (2^2), and peaks at ~33.5% (2^3). This is the top-performing method.
* **DiscPRM-14B (Teal, Circles):** Shows a steady upward trend. Starts at ~20.0% (2^0), rises to ~23.5% (2^1), ~26.5% (2^2), and ends at ~30.0% (2^3).
* **LLM-as-a-judge (Blue, Circles):** Shows an upward trend with a plateau. Starts at ~20.0% (2^0), rises to ~23.5% (2^1), remains flat at ~23.5% (2^2), then jumps to ~30.0% (2^3).
* **Majority (Tan, Circles):** Shows a flat trend. Accuracy remains constant at ~20.0% across all values of N (2^0 to 2^3).
**Right Chart: MATH-500 (Generator: Qwen2.5-14B)**
* **ThinkPRM-14B (Orange, Stars):** Shows a strong, consistent upward trend. Starts at ~51% (2^0), rises to ~62% (2^1), ~69% (2^2), ~77% (2^3), ~79% (2^4), ~83% (2^5), and peaks at ~86% (2^6). This is the top-performing method.
* **DiscPRM-14B (Teal, Circles):** Shows an upward trend that plateaus. Starts at ~51% (2^0), rises to ~61% (2^1), ~67% (2^2), ~73% (2^3), remains flat at ~73% (2^4), rises slightly to ~74% (2^5), and ends at ~80% (2^6).
* **LLM-as-a-judge (Blue, Circles):** Shows an upward trend that plateaus. Starts at ~51% (2^0), rises to ~62% (2^1), ~68% (2^2), ~77% (2^3), dips slightly to ~76% (2^4), remains at ~76% (2^5), and ends at ~80% (2^6).
* **Majority (Tan, Circles):** Shows an upward trend with a late surge. Starts at ~51% (2^0), remains flat at ~51% (2^1), rises to ~68% (2^2), ~74% (2^3), dips slightly to ~73% (2^4), rises to ~74% (2^5), and ends at ~78% (2^6).
### Key Observations
1. **Dominant Method:** `ThinkPRM-14B` is the clear top performer on both datasets, showing the steepest and most consistent improvement as the number of solutions (N) increases.
2. **Dataset/Generator Impact:** The absolute accuracy values are significantly higher on the MATH-500 dataset (right chart, 50-86% range) compared to AIME '24 (left chart, 20-33.5% range). This is likely due to both the inherent difficulty of the datasets and the different generator models used (14B vs. 32B-Instruct).
3. **Majority Baseline Behavior:** The `Majority` voting baseline shows no improvement with more solutions on the harder AIME '24 task (flat line), but does improve on the MATH-500 task, especially for N >= 4 (2^2).
4. **Plateauing Effects:** On the MATH-500 chart, both `DiscPRM-14B` and `LLM-as-a-judge` show signs of performance plateauing between N=8 (2^3) and N=32 (2^5) before a final increase at N=64 (2^6).
5. **LLM-as-a-judge Anomaly:** On the AIME '24 chart, `LLM-as-a-judge` shows an unusual plateau between N=2 (2^1) and N=4 (2^2) before catching up to `DiscPRM-14B` at N=8 (2^3).
### Interpretation
The data demonstrates the effectiveness of the `ThinkPRM-14B` method for improving mathematical problem-solving accuracy through a "Best-of-N" sampling strategy. The core finding is that generating and selecting from multiple solutions (increasing N) reliably boosts performance, but the degree of improvement is highly dependent on the selection method.
* **ThinkPRM-14B's superiority** suggests its internal process for ranking or scoring solution candidates is more aligned with true correctness than the alternatives (`DiscPRM-14B`, `LLM-as-a-judge`).
* The **failure of the Majority baseline on AIME '24** indicates that for very challenging problems, simply generating more solutions and taking a vote is ineffective; the solutions are likely all incorrect or diverse in wrong answers. Its success on MATH-500 suggests that for moderately difficult problems, increased sampling can surface the correct answer more frequently.
* The **plateaus observed** (e.g., `LLM-as-a-judge` on AIME '24, multiple methods on MATH-500) may indicate points of diminishing returns for those specific methods, where generating additional solutions provides little to no marginal benefit until a larger threshold (e.g., N=64) is crossed.
* The comparison across two different datasets and generator models shows the **robustness of the trend**: `ThinkPRM-14B` consistently outperforms other methods, making it a promising approach for scaling the capabilities of language models on reasoning tasks via inference-time computation (generating more solutions).