## t-SNE Visualization: Music Genre Distribution Across Valid and Test Sets
### Overview
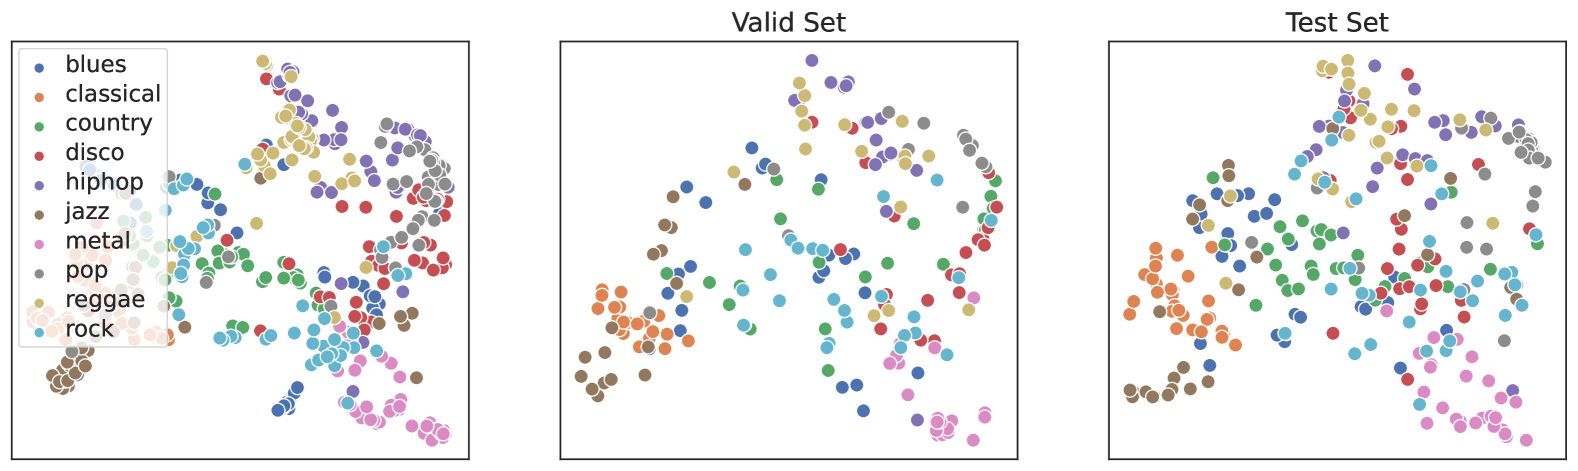
The image presents a t-SNE visualization of music genre distributions across three panels: **Valid Set** (left), **Test Set** (middle), and **Test Set** (right). Each panel uses colored dots to represent 10 distinct music genres, as defined by the legend. The visualization highlights clustering patterns and spatial relationships between genres in both datasets.
---
### Components/Axes
- **Legend**: Located in the top-left corner of the leftmost panel. It maps 10 music genres to specific colors:
- **Blues**: Blue
- **Classical**: Orange
- **Country**: Green
- **Disco**: Red
- **Hiphop**: Purple
- **Jazz**: Brown
- **Metal**: Pink
- **Pop**: Gray
- **Reggae**: Light Blue
- **Rock**: Dark Blue
- **Panels**:
- **Valid Set** (left): Represents the validation dataset.
- **Test Set** (middle and right): Represents the test dataset (appears duplicated in the image).
- **Axes**: No explicit axis labels or scales are visible. The visualization focuses on 2D spatial clustering.
---
### Detailed Analysis
#### Valid Set (Left Panel)
- **Blues (Blue)**: Clustered on the far left.
- **Classical (Orange)**: Positioned in the bottom-left quadrant.
- **Country (Green)**: Centered in the middle of the panel.
- **Disco (Red)**: Located on the far right.
- **Hiphop (Purple)**: Top-right quadrant.
- **Jazz (Brown)**: Bottom-left quadrant (overlapping with Classical).
- **Metal (Pink)**: Bottom-right quadrant.
- **Pop (Gray)**: Top-right quadrant (overlapping with Hiphop).
- **Reggae (Light Blue)**: Centered, slightly overlapping with Country.
- **Rock (Dark Blue)**: Top-left quadrant (overlapping with Blues).
#### Test Set (Middle Panel)
- **Blues (Blue)**: Clustered on the left, slightly more dispersed than in the Valid Set.
- **Classical (Orange)**: Bottom-left quadrant, more spread out.
- **Country (Green)**: Centered, with tighter clustering.
- **Disco (Red)**: Right side, slightly more dispersed.
- **Hiphop (Purple)**: Top-right quadrant, less dense than in the Valid Set.
- **Jazz (Brown)**: Bottom-left quadrant, more dispersed.
- **Metal (Pink)**: Bottom-right quadrant, more concentrated.
- **Pop (Gray)**: Top-right quadrant, more concentrated.
- **Reggae (Light Blue)**: Centered, similar to Valid Set.
- **Rock (Dark Blue)**: Top-left quadrant, slightly closer to Blues than in the Valid Set.
#### Test Set (Right Panel)
- **Blues (Blue)**: Left side, similar to the middle Test Set.
- **Classical (Orange)**: Bottom-left quadrant, more dispersed.
- **Country (Green)**: Centered, with tighter clustering.
- **Disco (Red)**: Right side, slightly more dispersed.
- **Hiphop (Purple)**: Top-right quadrant, less dense.
- **Jazz (Brown)**: Bottom-left quadrant, more dispersed.
- **Metal (Pink)**: Bottom-right quadrant, more concentrated.
- **Pop (Gray)**: Top-right quadrant, more concentrated.
- **Reggae (Light Blue)**: Centered, similar to other panels.
- **Rock (Dark Blue)**: Top-left quadrant, slightly closer to Blues.
---
### Key Observations
1. **Blues and Rock Separation**: In the Valid Set, Blues (blue) and Rock (dark blue) are distinctly separated on the left and top-left, respectively. In the Test Sets, their separation decreases, suggesting overlapping features in the test data.
2. **Classical and Jazz Dispersion**: Classical (orange) and Jazz (brown) are more dispersed in the Test Sets compared to the Valid Set, indicating greater variability in these genres in the test data.
3. **Metal and Pop Concentration**: Metal (pink) and Pop (gray) clusters are more tightly packed in the Test Sets, suggesting similar feature representations in these genres.
4. **Reggae Consistency**: Reggae (light blue) remains centered across all panels, indicating stable representation.
5. **Overlap**: Some genres (e.g., Jazz and Classical in the Valid Set) overlap spatially, suggesting shared characteristics.
---
### Interpretation
The t-SNE visualization reveals how music genres are distributed in the Valid and Test Sets. The **Valid Set** shows clearer genre separation (e.g., Blues and Rock), while the **Test Set** exhibits increased dispersion for Classical and Jazz, possibly due to greater variability in the test data. The concentration of Metal and Pop in the Test Set suggests these genres share more features in the test data. The duplication of the Test Set panels may indicate a redundancy or error in the visualization, but the consistent clustering patterns across panels imply robustness in the test data representation. This analysis highlights how genre-specific features are preserved or altered between datasets, which could inform model training or evaluation strategies.