\n
## Line Chart: Pass@k vs. Number of Sample k
### Overview
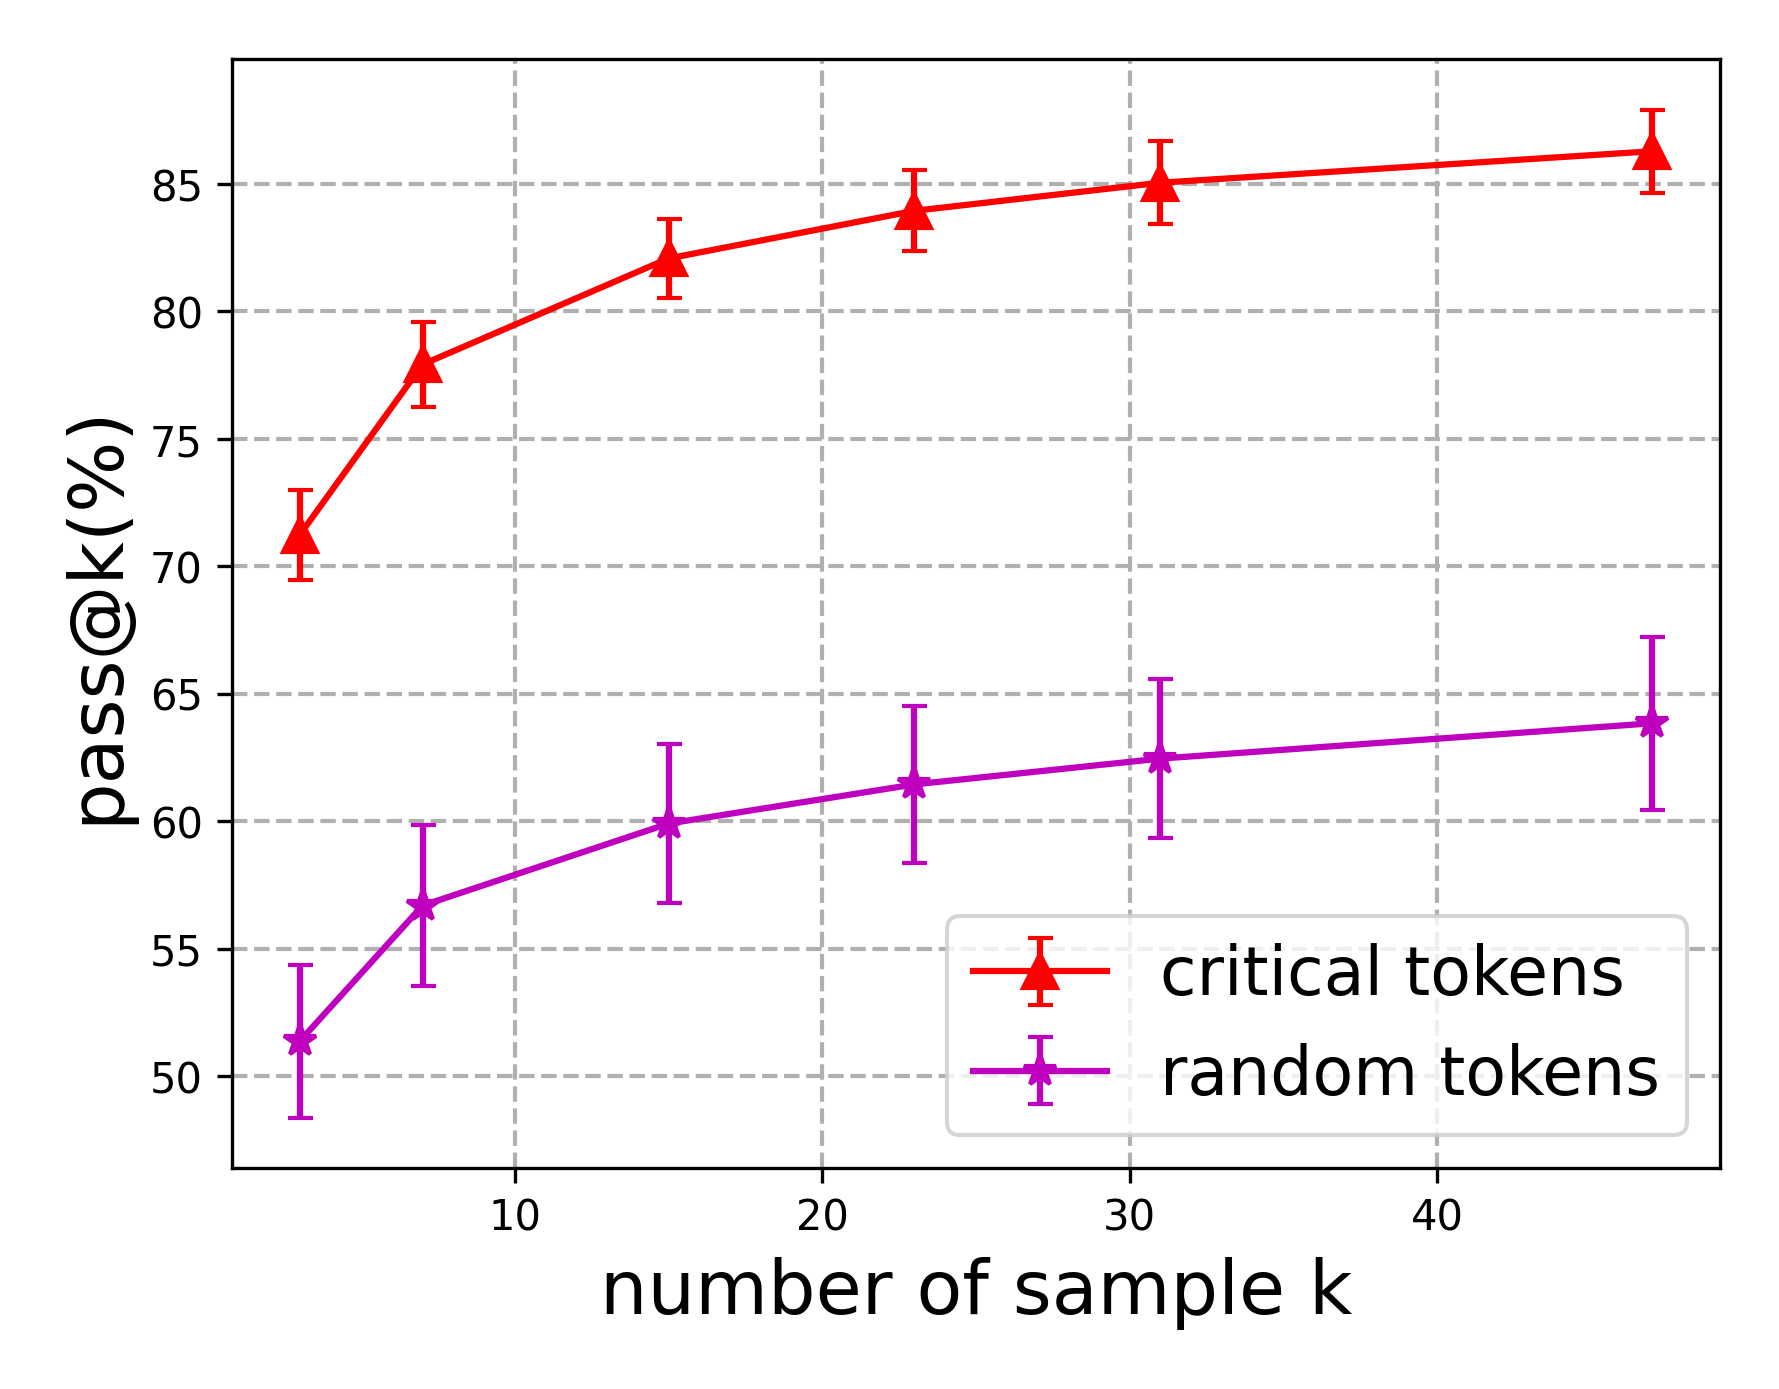
This line chart compares the "pass@k%" metric for two categories: "critical tokens" and "random tokens" as a function of the "number of sample k". Error bars are included for each data point, indicating the variability or confidence interval.
### Components/Axes
* **X-axis:** "number of sample k". Scale ranges from approximately 0 to 45, with markers at 0, 10, 20, 30, and 40.
* **Y-axis:** "pass@k%". Scale ranges from approximately 50% to 87%, with markers at 50%, 55%, 60%, 65%, 70%, 75%, 80%, and 85%.
* **Data Series 1:** "critical tokens" - Represented by a red line with triangular markers and error bars.
* **Data Series 2:** "random tokens" - Represented by a purple line with square markers and error bars.
* **Legend:** Located in the bottom-right corner, clearly labeling each data series with its corresponding color.
### Detailed Analysis
**Critical Tokens (Red Line):**
The line representing "critical tokens" slopes generally upward, indicating an increasing "pass@k%" with increasing "number of sample k".
* At k = 0, pass@k% is approximately 71% ± 4%.
* At k = 10, pass@k% is approximately 78% ± 3%.
* At k = 20, pass@k% is approximately 82% ± 2%.
* At k = 30, pass@k% is approximately 84% ± 2%.
* At k = 40, pass@k% is approximately 85% ± 2%.
**Random Tokens (Purple Line):**
The line representing "random tokens" also slopes upward, but at a slower rate than the "critical tokens" line.
* At k = 0, pass@k% is approximately 52% ± 5%.
* At k = 10, pass@k% is approximately 58% ± 4%.
* At k = 20, pass@k% is approximately 61% ± 3%.
* At k = 30, pass@k% is approximately 63% ± 3%.
* At k = 40, pass@k% is approximately 65% ± 4%.
### Key Observations
* "Critical tokens" consistently achieve a higher "pass@k%" than "random tokens" across all values of "number of sample k".
* The difference in "pass@k%" between the two categories appears to be more pronounced at lower values of "number of sample k".
* The error bars suggest that the "critical tokens" data has slightly less variability than the "random tokens" data.
* Both lines appear to be approaching a plateau as "number of sample k" increases, suggesting diminishing returns.
### Interpretation
The data suggests that using "critical tokens" leads to a significantly higher "pass@k%" compared to using "random tokens". This implies that selecting tokens based on their importance or criticality is a more effective strategy for achieving a desired level of performance (as measured by "pass@k%"). The diminishing returns observed at higher values of "number of sample k" suggest that there is a point beyond which increasing the sample size provides minimal improvement. The smaller error bars for "critical tokens" indicate a more consistent and reliable performance compared to "random tokens". This chart likely represents the results of an experiment evaluating different token selection strategies in a machine learning or natural language processing context, where "pass@k%" is a metric for evaluating the quality of generated outputs. The "number of sample k" likely refers to the number of candidate tokens considered during the generation process.