## Scatter Plot: Accuracy vs. Time-to-Answer
### Overview
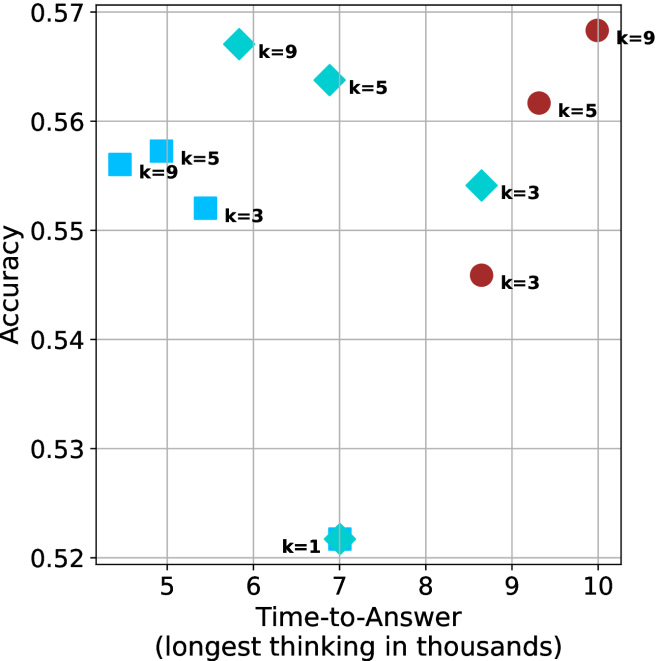
This image is a scatter plot visualizing the relationship between "Accuracy" (y-axis) and "Time-to-Answer" (x-axis). The data points are categorized into four distinct groups based on marker shape and color, with each point labeled with a "k" value (k=1, k=3, k=5, k=9). The chart uses a grid background to assist in estimating the values of the data points.
### Components/Axes
* **Y-Axis:** Labeled "Accuracy". The scale ranges from 0.52 to 0.57, with major grid lines at 0.01 intervals.
* **X-Axis:** Labeled "Time-to-Answer (longest thinking in thousands)". The scale ranges from 5 to 10, with major grid lines at 1.0 intervals.
* **Data Series (Color/Shape Coding):**
* **Light Blue Squares:** Located on the left side of the chart (x < 6).
* **Cyan/Teal Diamonds:** Located in the center-right of the chart (x between 5.5 and 9).
* **Maroon/Dark Red Circles:** Located on the right side of the chart (x > 8.5).
* **Cyan/Teal Star/Cross:** A single point located at the bottom center (x = 7).
### Detailed Analysis
The following coordinates are approximate based on the grid lines provided:
**1. Light Blue Squares (Fastest, Lower Accuracy)**
* **k=9:** Positioned at x ≈ 4.5, y ≈ 0.556.
* **k=5:** Positioned at x ≈ 4.8, y ≈ 0.557.
* **k=3:** Positioned at x ≈ 5.3, y ≈ 0.552.
* *Trend:* This group is clustered on the far left, indicating the lowest "Time-to-Answer" values.
**2. Cyan/Teal Diamonds (Moderate Speed, Higher Accuracy)**
* **k=9:** Positioned at x ≈ 5.8, y ≈ 0.567.
* **k=5:** Positioned at x ≈ 6.8, y ≈ 0.564.
* **k=3:** Positioned at x ≈ 8.6, y ≈ 0.554.
* *Trend:* Within this group, as "k" decreases, the "Time-to-Answer" increases significantly, while accuracy decreases.
**3. Maroon/Dark Red Circles (Slowest, Variable Accuracy)**
* **k=9:** Positioned at x ≈ 10.0, y ≈ 0.568.
* **k=5:** Positioned at x ≈ 9.1, y ≈ 0.562.
* **k=3:** Positioned at x ≈ 8.6, y ≈ 0.546.
* *Trend:* This group occupies the rightmost section of the chart, representing the highest "Time-to-Answer" values. Similar to the diamond group, lower "k" values here correlate with lower accuracy.
**4. Cyan/Teal Star/Cross (Outlier)**
* **k=1:** Positioned at x = 7.0, y ≈ 0.522.
* *Trend:* This is a distinct outlier, representing the lowest accuracy on the entire chart.
### Key Observations
* **Performance Trade-off:** There is a clear trade-off between "Time-to-Answer" and "Accuracy." The models that take the longest time (Maroon Circles) generally achieve the highest accuracy, while the fastest models (Light Blue Squares) have moderate accuracy.
* **The "k" Parameter:** Across all three main groups (Squares, Diamonds, Circles), a higher "k" value consistently yields higher accuracy than a lower "k" value within that same group.
* **Outlier:** The "k=1" point (Star/Cross) is significantly less accurate than all other data points, regardless of the time taken.
* **Clustering:** The data is clearly segmented into three distinct "speed" tiers based on the x-axis: Fast (Squares), Medium (Diamonds), and Slow (Circles).
### Interpretation
This chart likely represents a performance evaluation of a machine learning model (possibly k-Nearest Neighbors or a similar algorithm where 'k' is a hyperparameter) across different configurations or datasets.
* **Computational Cost:** The x-axis ("Time-to-Answer") acts as a proxy for computational cost. The Maroon group is the most computationally expensive.
* **Optimal Configuration:** The "k=9" configuration consistently performs best in terms of accuracy across all three groups.
* **Diminishing Returns:** While the Maroon group (k=9) achieves the highest absolute accuracy (≈ 0.568), it requires significantly more time (x=10) compared to the Cyan Diamond group (k=9), which achieves nearly identical accuracy (≈ 0.567) but in much less time (x ≈ 5.8). Therefore, the Cyan Diamond (k=9) configuration appears to be the most efficient choice, offering a high accuracy-to-time ratio.
* **Failure Case:** The "k=1" configuration is clearly suboptimal and should likely be avoided in this specific application.