## Diagram: Feature Representation
### Overview
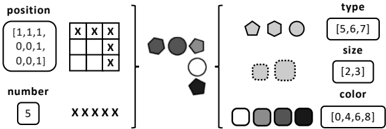
The image illustrates a feature representation scheme, showing how different attributes of an object (position, number, type, size, color) can be encoded. It uses visual examples and numerical ranges to represent these features.
### Components/Axes
* **Position:**
* A 3x3 grid with 'X' marks indicating positions. The 'X' marks are located at the top row (all three positions), the middle right position, and the bottom right position.
* A numerical representation: `[1,1,1, 0,0,1, 0,0,1]`
* **Number:**
* A numerical value: `5`
* A visual representation: Five 'X' marks.
* **Type:**
* Visual representations of three shapes: a pentagon, a hexagon, and a circle.
* Numerical representation: `[5,6,7]`
* **Size:**
* Visual representations of two squares with dotted outlines.
* Numerical representation: `[2,3]`
* **Color:**
* Visual representations of four squares with different shades of gray, ranging from white to black.
* Numerical representation: `[0,4,6,8]`
### Detailed Analysis
* **Position:** The grid shows three 'X' marks in the top row, and one 'X' mark each in the middle-right and bottom-right positions. The numerical representation `[1,1,1, 0,0,1, 0,0,1]` likely corresponds to the presence (1) or absence (0) of an object in each position of the 3x3 grid, read row by row.
* **Number:** The number 5 is represented both numerically and visually with five 'X' marks.
* **Type:** The shapes (pentagon, hexagon, circle) are associated with the numerical range `[5,6,7]`. This suggests that each shape is assigned a numerical identifier.
* **Size:** The two squares with dotted outlines are associated with the numerical range `[2,3]`. This suggests that each square is assigned a numerical identifier.
* **Color:** The four shades of gray (white, light gray, dark gray, black) are associated with the numerical range `[0,4,6,8]`. This suggests that each color is assigned a numerical identifier.
### Key Observations
* The diagram uses both visual and numerical representations for each feature.
* The numerical representations appear to be encoding categorical or discrete values.
* The position feature uses a grid-based representation.
### Interpretation
The diagram illustrates a method for encoding object features into numerical representations, likely for use in a machine learning or computer vision system. Each feature (position, number, type, size, color) is mapped to a numerical value or a set of numerical values. This allows the system to process and analyze objects based on their attributes. The use of both visual and numerical representations makes the encoding scheme more intuitive and easier to understand.