\n
## Diagram: Visual Representation of Object Attributes
### Overview
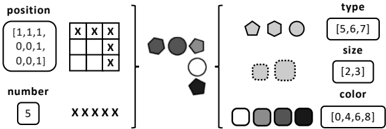
The image presents a diagram illustrating the attributes of a set of objects. These attributes are position, number, type, size, and color. The diagram uses a combination of a grid, symbols, and labeled boxes to represent these attributes. It appears to be a visual encoding of data, potentially for a dataset of objects.
### Components/Axes
The diagram is divided into four main sections, arranged horizontally.
* **Position:** A 3x3 grid with "X" marks indicating object locations. The coordinates are labeled as [1,1,1], [0,0,1], [0,0,11].
* **Number:** A box containing the number "5" and five "X" symbols.
* **Type:** A set of shapes (pentagons and circles) with the label "type" and the range [5,6,7].
* **Size:** A set of shapes (solid and dotted circles) with the label "size" and the range [2,3].
* **Color:** A set of filled circles with varying shades of gray and black, labeled "color" and the range [0,4,6,8].
### Detailed Analysis or Content Details
**Position:**
The grid shows "X" marks at the following coordinates: (0,0), (0,1), (0,2), (1,0), (1,2). The grid is labeled with coordinates [1,1,1], [0,0,1], [0,0,11] at the top left.
**Number:**
There are 5 "X" symbols, corresponding to the number "5" in the box.
**Type:**
There are three distinct shapes representing types:
* Pentagon (appears twice)
* Solid Circle (appears once)
* Dotted Circle (appears once)
The type range is [5,6,7].
**Size:**
There are two distinct shapes representing sizes:
* Solid Circle (size 2)
* Dotted Circle (size 3)
The size range is [2,3].
**Color:**
There are four distinct shades of gray and black representing colors:
* White (color 0)
* Light Gray (color 4)
* Medium Gray (color 6)
* Black (color 8)
The color range is [0,4,6,8].
The objects are visually represented as follows:
* A dark gray pentagon.
* A medium gray pentagon.
* A light gray circle.
* A black pentagon.
* A white dotted circle.
* A light gray dotted circle.
### Key Observations
The diagram presents a clear mapping between visual attributes (shape, color, size) and numerical values. The "position" attribute is represented by a grid, while the other attributes are represented by variations in shape, size, and color. The number of objects is explicitly stated as 5.
### Interpretation
The diagram appears to be a visual encoding of a dataset containing 5 objects. Each object is characterized by its position, type, size, and color. The diagram allows for a quick visual assessment of the distribution of these attributes across the dataset. The use of different shapes and colors suggests that these attributes are categorical or discrete. The ranges provided for type, size, and color indicate the possible values these attributes can take. The diagram could be used for data exploration, visualization, or communication of data characteristics. The grid representation of position suggests a spatial component to the data.