## Stacked Bar Chart: Task Solving Performance by Method and Complexity Level
### Overview
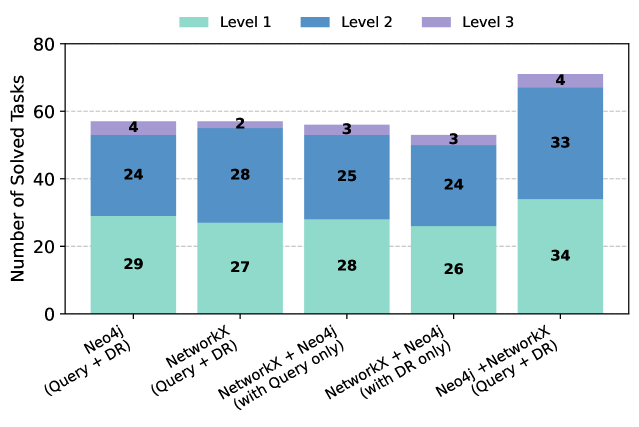
This image is a stacked bar chart comparing the performance of five different computational methods or system configurations in solving tasks. The performance is measured by the total number of tasks solved, broken down by three complexity levels (Level 1, Level 2, Level 3). The chart visually demonstrates how each method's total solved tasks are composed of tasks from these different levels.
### Components/Axes
* **Chart Type:** Stacked Bar Chart.
* **Y-Axis:**
* **Label:** "Number of Solved Tasks"
* **Scale:** Linear scale from 0 to 80, with major gridlines at intervals of 20 (0, 20, 40, 60, 80).
* **X-Axis:**
* **Label:** None explicit. The axis displays categorical labels for five distinct methods/configurations.
* **Categories (from left to right):**
1. `Neo4j (Query + DR)`
2. `NetworkX (Query + DR)`
3. `NetworkX + Neo4j (with Query only)`
4. `NetworkX + Neo4j (with DR only)`
5. `Neo4j + NetworkX (Query + DR)`
* **Legend:**
* **Position:** Top center, above the plot area.
* **Entries:**
* **Level 1:** Represented by a mint green color.
* **Level 2:** Represented by a medium blue color.
* **Level 3:** Represented by a lavender/light purple color.
* **Data Labels:** Each segment of every stacked bar contains a numerical label indicating the exact count of solved tasks for that specific level within that method.
### Detailed Analysis
The chart presents the following data for each method, broken down by level:
1. **Neo4j (Query + DR)**
* **Level 1 (Mint Green):** 29 tasks
* **Level 2 (Blue):** 24 tasks
* **Level 3 (Lavender):** 4 tasks
* **Total Solved Tasks:** 57 (29 + 24 + 4)
2. **NetworkX (Query + DR)**
* **Level 1 (Mint Green):** 27 tasks
* **Level 2 (Blue):** 28 tasks
* **Level 3 (Lavender):** 2 tasks
* **Total Solved Tasks:** 57 (27 + 28 + 2)
3. **NetworkX + Neo4j (with Query only)**
* **Level 1 (Mint Green):** 28 tasks
* **Level 2 (Blue):** 25 tasks
* **Level 3 (Lavender):** 3 tasks
* **Total Solved Tasks:** 56 (28 + 25 + 3)
4. **NetworkX + Neo4j (with DR only)**
* **Level 1 (Mint Green):** 26 tasks
* **Level 2 (Blue):** 24 tasks
* **Level 3 (Lavender):** 3 tasks
* **Total Solved Tasks:** 53 (26 + 24 + 3)
5. **Neo4j + NetworkX (Query + DR)**
* **Level 1 (Mint Green):** 34 tasks
* **Level 2 (Blue):** 33 tasks
* **Level 3 (Lavender):** 4 tasks
* **Total Solved Tasks:** 71 (34 + 33 + 4)
**Visual Trend Verification:**
* The **Level 1 (Mint Green)** segment is the largest component in every bar, indicating that the majority of solved tasks across all methods are of the lowest complexity.
* The **Level 2 (Blue)** segment is consistently the second-largest component.
* The **Level 3 (Lavender)** segment is the smallest in all cases, forming a thin cap on each bar.
* The total height of the bars (total solved tasks) is relatively similar for the first four methods (ranging from 53 to 57), but the fifth bar (`Neo4j + NetworkX (Query + DR)`) is noticeably taller, indicating superior overall performance.
### Key Observations
1. **Top Performer:** The method `Neo4j + NetworkX (Query + DR)` solves the most tasks overall (71), outperforming the next best methods by a significant margin (14 more tasks).
2. **Consistent Level Distribution:** The proportional contribution of each level (L1 > L2 > L3) is consistent across all methods. No method shows a disproportionate strength in higher-level tasks.
3. **Query + DR Synergy:** The two methods explicitly labeled with `(Query + DR)` (the first and last bars) are the top two performers. The combined `Neo4j + NetworkX` configuration with both capabilities is the most effective.
4. **Impact of Isolation:** The method `NetworkX + Neo4j (with DR only)` has the lowest total score (53), suggesting that using only the "DR" component in this hybrid setup is less effective than using only "Query" (56 tasks) or both.
5. **Low High-Level Task Completion:** Across all methods, the number of solved Level 3 tasks is very low (2-4), indicating these tasks are significantly more challenging for all tested configurations.
### Interpretation
This chart provides a comparative analysis of system architectures for automated task solving, likely in the domain of graph-based reasoning or database querying (given the mention of Neo4j and NetworkX). The data suggests several key insights:
* **Integration is Key:** The most effective approach is not using Neo4j or NetworkX in isolation, but integrating them (`Neo4j + NetworkX`). Furthermore, this integration yields the best results when both core capabilities—referred to as "Query" and "DR" (likely Data Retrieval or Reasoning)—are active. This points to a synergistic effect where the strengths of one system compensate for the limitations of the other.
* **Complexity Barrier:** The stark drop-off in solved tasks from Level 1 to Level 3 across all methods indicates a fundamental challenge in handling high-complexity tasks. The systems' capabilities appear to plateau at lower-complexity problems. Future development would need to focus specifically on the algorithms or knowledge representations required for Level 3 tasks.
* **Performance Baseline:** The first four methods establish a performance baseline between 53-57 solved tasks. The significant jump to 71 tasks with the fully integrated system demonstrates that architectural choices have a substantial impact on capability, beyond incremental improvements.
* **Component Contribution:** The "Query" component appears slightly more valuable than "DR" when used in isolation within the hybrid model (56 vs. 53 tasks). However, the true value is unlocked when both are combined with the integrated graph systems.
In summary, the chart advocates for a holistic, integrated system design (`Neo4j + NetworkX`) that leverages both query and data retrieval/reasoning functionalities to maximize performance, while also highlighting a clear research target for improving performance on the most complex (Level 3) tasks.