## Line Chart: Risk-Coverage Curve (Dialect Task)
### Overview
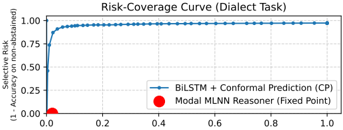
The chart compares two approaches for risk-coverage performance in a dialect task: "BiLSTM + Conformal Prediction (CP)" and "Modal MLNN Reasoner (Fixed Point)". The y-axis represents "Selective Risk (1 - Accuracy on non-abstained)" (0.00–1.00), while the x-axis represents "Risk-Coverage" (0.0–1.0). The blue line (BiLSTM + CP) shows a steep initial increase followed by a plateau, while the red data point (Modal MLNN) remains at the origin.
### Components/Axes
- **Y-Axis**: "Selective Risk (1 - Accuracy on non-abstained)" (0.00–1.00, increments of 0.25)
- **X-Axis**: "Risk-Coverage" (0.0–1.0, increments of 0.2)
- **Legend**:
- Blue line: "BiLSTM + Conformal Prediction (CP)"
- Red circle: "Modal MLNN Reasoner (Fixed Point)"
- **Placement**: Legend is positioned in the bottom-right corner.
### Detailed Analysis
- **BiLSTM + CP (Blue Line)**:
- Starts at ~0.75 on the y-axis at x=0.0.
- Rises sharply to 1.00 by x=0.2.
- Remains flat at 1.00 for x=0.2–1.0.
- **Modal MLNN Reasoner (Red Circle)**:
- Single data point at (x=0.0, y=0.00).
### Key Observations
1. The BiLSTM + CP approach achieves near-perfect risk coverage (y=1.00) after x=0.2.
2. The Modal MLNN Reasoner shows no risk coverage (y=0.00) at x=0.0.
3. The blue line’s steep ascent suggests rapid improvement in performance with increasing risk-coverage.
### Interpretation
The chart demonstrates that the BiLSTM + Conformal Prediction method outperforms the Modal MLNN Reasoner in balancing risk and coverage for dialect tasks. The abrupt plateau at y=1.00 for BiLSTM + CP implies it achieves full accuracy on non-abstained data once risk-coverage exceeds 20% (x=0.2). In contrast, the Modal MLNN Reasoner fails to cover any risk at the measured point, highlighting a critical limitation. This suggests BiLSTM + CP is more robust for dialect tasks requiring high accuracy under constrained risk.