\n
## Radar Chart: Model Comparison Across Metrics
### Overview
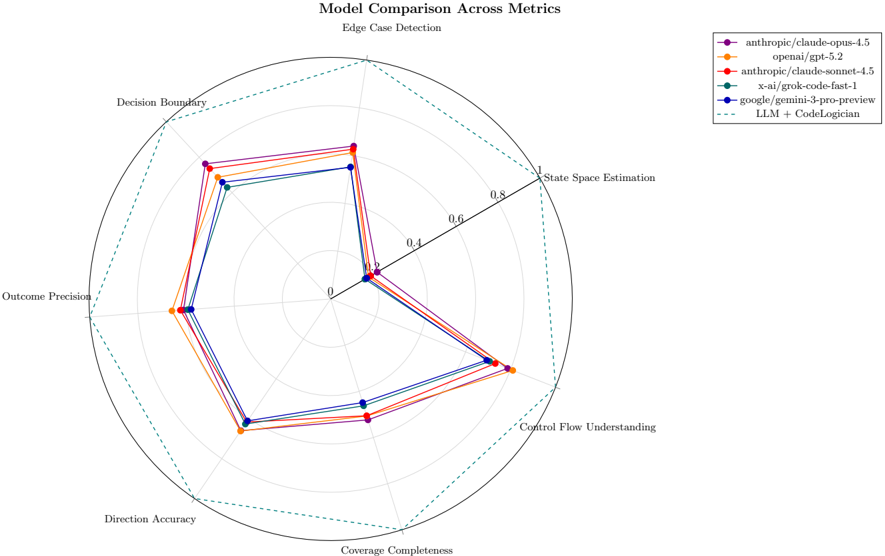
This image presents a radar chart comparing the performance of several language models across six different metrics related to edge case detection. The chart uses a radial layout with six axes representing the metrics, and each model's performance is plotted as a line connecting points on each axis.
### Components/Axes
* **Title:** "Model Comparison Across Metrics" (centered at the top)
* **Metrics (Axes):**
* Decision Boundary
* State Space Estimation
* Control Flow Understanding
* Coverage Completeness
* Direction Accuracy
* Outcome Precision
* **Scale:** The axes are scaled from 0 to 1, with concentric circles marked at 0.2, 0.4, 0.6, and 0.8.
* **Legend (Top-Right):**
* anthropic/claude-opus-4.5 (Magenta)
* openai/gpt-5.2 (Blue)
* anthropic/claude-sonnet-4.5 (Orange)
* x-ai/grok-code-fast-1 (Green)
* google/gemini-3-pro-preview (Dark Blue)
* LLM + CodeLogician (Black Dashed Line)
### Detailed Analysis
The chart displays the relative performance of each model on each metric. The values are approximate, based on visual estimation.
* **anthropic/claude-opus-4.5 (Magenta):** This model shows a generally high performance across all metrics.
* Decision Boundary: ~0.9
* State Space Estimation: ~0.85
* Control Flow Understanding: ~0.75
* Coverage Completeness: ~0.7
* Direction Accuracy: ~0.7
* Outcome Precision: ~0.8
* **openai/gpt-5.2 (Blue):** This model exhibits a relatively consistent performance, slightly lower than claude-opus-4.5.
* Decision Boundary: ~0.75
* State Space Estimation: ~0.7
* Control Flow Understanding: ~0.65
* Coverage Completeness: ~0.6
* Direction Accuracy: ~0.6
* Outcome Precision: ~0.7
* **anthropic/claude-sonnet-4.5 (Orange):** This model shows a moderate performance, with some fluctuations.
* Decision Boundary: ~0.65
* State Space Estimation: ~0.6
* Control Flow Understanding: ~0.55
* Coverage Completeness: ~0.5
* Direction Accuracy: ~0.5
* Outcome Precision: ~0.6
* **x-ai/grok-code-fast-1 (Green):** This model has a variable performance, with some metrics showing higher values than others.
* Decision Boundary: ~0.7
* State Space Estimation: ~0.65
* Control Flow Understanding: ~0.5
* Coverage Completeness: ~0.45
* Direction Accuracy: ~0.4
* Outcome Precision: ~0.55
* **google/gemini-3-pro-preview (Dark Blue):** This model demonstrates a relatively low performance across all metrics.
* Decision Boundary: ~0.5
* State Space Estimation: ~0.45
* Control Flow Understanding: ~0.4
* Coverage Completeness: ~0.35
* Direction Accuracy: ~0.3
* Outcome Precision: ~0.4
* **LLM + CodeLogician (Black Dashed Line):** This model shows a performance that is generally lower than the other models, with a particularly low score on Coverage Completeness.
* Decision Boundary: ~0.55
* State Space Estimation: ~0.5
* Control Flow Understanding: ~0.45
* Coverage Completeness: ~0.25
* Direction Accuracy: ~0.35
* Outcome Precision: ~0.45
### Key Observations
* `anthropic/claude-opus-4.5` consistently outperforms other models across all metrics.
* `google/gemini-3-pro-preview` and `LLM + CodeLogician` consistently show the lowest performance.
* The models exhibit varying strengths and weaknesses across different metrics. For example, `x-ai/grok-code-fast-1` performs relatively better on Decision Boundary but worse on Direction Accuracy.
* The shape of the radar chart for each model is distinct, indicating different performance profiles.
### Interpretation
The radar chart effectively visualizes the trade-offs between different language models in the context of edge case detection. The chart suggests that `anthropic/claude-opus-4.5` is the most robust model overall, demonstrating strong capabilities across all evaluated metrics. The differences in performance profiles highlight the importance of considering specific application requirements when selecting a model. For instance, if Decision Boundary is critical, `x-ai/grok-code-fast-1` might be a viable option despite its lower performance in other areas. The relatively poor performance of `google/gemini-3-pro-preview` and `LLM + CodeLogician` suggests that these models may require further development to achieve comparable performance in edge case detection. The chart provides a clear and concise comparison, enabling informed decision-making regarding model selection. The use of a radar chart is particularly effective for visualizing multi-dimensional data and identifying relative strengths and weaknesses.