\n
## Diagram: State Transition with Permutation
### Overview
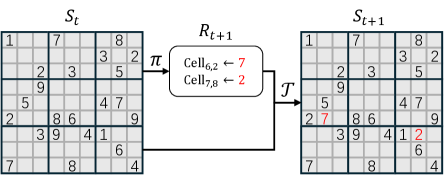
The image depicts a diagram illustrating a state transition process. It shows a grid-based state *S<sub>t</sub>* at time *t*, a permutation operation *π*, a transformation *T*, and the resulting state *S<sub>t+1</sub>* at time *t+1*. The diagram highlights specific cell updates within the grid.
### Components/Axes
The diagram consists of three main grid structures labeled *S<sub>t</sub>*, *R<sub>t+1</sub>*, and *S<sub>t+1</sub>*, connected by arrows representing operations. The grid is 8x8. There is a box labeled *R<sub>t+1</sub>* between *S<sub>t</sub>* and *S<sub>t+1</sub>* with text inside. An arrow labeled *π* connects *S<sub>t</sub>* to *R<sub>t+1</sub>*. An arrow labeled *T* connects *R<sub>t+1</sub>* to *S<sub>t+1</sub>*.
### Content Details
* **S<sub>t</sub> (Initial State):** An 8x8 grid filled with numerical values ranging from 1 to 9. The values are distributed seemingly randomly across the grid.
* Row 1: 1, 7, _, _, _, _, 8, _
* Row 2: _, 2, 3, _, 5, _, _, _
* Row 3: _, _, 9, _, _, _, 4, 7
* Row 4: 5, 2, 8, 6, _, 9, _, _
* Row 5: _, _, 3, 9, 4, 1, _, 6
* Row 6: _, _, _, _, _, _, _, 4
* Row 7: 7, _, _, 8, _, _, _, _
* **R<sub>t+1</sub> (Permutation):** A rectangular box containing the following text:
* "Cell<sub>6,2</sub> ← 7"
* "Cell<sub>7,8</sub> ← 2"
* **S<sub>t+1</sub> (Next State):** An 8x8 grid, largely identical to *S<sub>t</sub>*, but with two specific cells updated.
* Row 1: 1, 7, _, _, _, _, 8, _
* Row 2: _, 2, 3, _, 5, _, _, _
* Row 3: _, _, 9, _, _, _, 4, 7
* Row 4: 5, 2, 8, 6, _, 9, _, _
* Row 5: _, _, 3, 9, 4, 1, _, 6
* Row 6: _, 7, _, _, _, _, _, 4
* Row 7: 7, _, _, 8, _, _, 2, _
### Key Observations
The diagram illustrates a state update where specific cells in the initial state *S<sub>t</sub>* are modified to produce the next state *S<sub>t+1</sub>*. The permutation *π* appears to select cells from *S<sub>t</sub>* and assign their values to specific cells in *R<sub>t+1</sub>*. The transformation *T* then applies these changes from *R<sub>t+1</sub>* to *S<sub>t+1</sub>*. Specifically, the value in cell (6,2) of *S<sub>t+1</sub>* is changed from its original value in *S<sub>t</sub>* to 7, and the value in cell (7,8) of *S<sub>t+1</sub>* is changed from its original value in *S<sub>t</sub>* to 2.
### Interpretation
This diagram likely represents a step in a larger process, such as a cellular automaton or a reinforcement learning environment. The state *S<sub>t</sub>* represents the environment's configuration at a given time step. The permutation *π* and transformation *T* define the rules governing how the environment evolves. The diagram highlights that only a small number of cells are updated in each time step, suggesting a sparse update rule. The notation "Cell<sub>6,2</sub> ← 7" indicates that the value of cell (6,2) is *assigned* the value 7, not incremented or modified in a more complex way. This suggests a discrete state space. The diagram is a simplified representation of a dynamic system, focusing on the key elements of state, transition, and update. The use of subscripts (t and t+1) indicates a time-series or sequential nature to the process.