\n
## Diagram: Sudoku State Transformation Process
### Overview
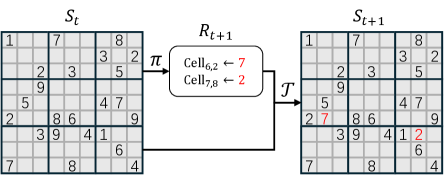
The image is a technical diagram illustrating a single-step transformation process for a Sudoku puzzle state. It shows an initial grid state (S_t), a transformation rule (R_{t+1}) that updates specific cells, and the resulting grid state (S_{t+1}). The process is mediated by two functions or operators, denoted by the Greek letters π (pi) and T.
### Components/Axes
The diagram consists of three primary components arranged horizontally from left to right:
1. **Left Component (S_t):** A 9x9 grid representing the initial state of a Sudoku puzzle at time step `t`. The grid is divided into nine 3x3 boxes by thicker lines. Cells contain numbers (1-9) or are empty.
2. **Middle Component (R_{t+1}):** A rounded rectangle labeled `R_{t+1}`. It contains two lines of text specifying cell updates:
* `cell_{6,2} ← 7`
* `cell_{7,9} ← 2`
An arrow labeled with the symbol `π` points from the S_t grid to this box.
3. **Right Component (S_{t+1}):** A 9x9 grid representing the resulting state at time step `t+1`. It is structurally identical to S_t. An arrow labeled with the symbol `T` points from the R_{t+1} box to this grid.
**Spatial Grounding:** The legend/transformation rule (R_{t+1}) is positioned centrally between the two state grids. The flow of information is strictly left-to-right: S_t → π → R_{t+1} → T → S_{t+1}.
### Detailed Analysis
**1. Initial State Grid (S_t):**
The grid contains the following numbers (row, column, value). Empty cells are denoted by `-`.
* Row 1: (1,1)=1, (1,3)=7, (1,7)=8, (1,9)=2
* Row 2: (2,2)=3, (2,5)=2, (2,8)=5, (2,9)=2
* Row 3: (3,2)=9, (3,7)=4, (3,8)=7
* Row 4: (4,1)=2, (4,3)=8, (4,4)=6, (4,9)=9
* Row 5: (5,2)=3, (5,3)=9, (5,4)=4, (5,5)=1, (5,8)=6
* Row 6: (6,1)=7, (6,4)=8, (6,8)=4
* Row 7: (7,2)=8, (7,9)=4
* Row 8: (8,1)=?, (8,2)=?, (8,3)=?, (8,4)=?, (8,5)=?, (8,6)=?, (8,7)=?, (8,8)=?, (8,9)=? (All cells in row 8 appear empty in the image).
* Row 9: (9,1)=?, (9,2)=?, (9,3)=?, (9,4)=?, (9,5)=?, (9,6)=?, (9,7)=?, (9,8)=?, (9,9)=? (All cells in row 9 appear empty in the image).
**2. Transformation Rule (R_{t+1}):**
The rule specifies two precise updates:
* Update 1: The cell at row 6, column 2 is assigned the value 7.
* Update 2: The cell at row 7, column 9 is assigned the value 2.
**3. Resulting State Grid (S_{t+1}):**
This grid is identical to S_t except for the two cells specified in R_{t+1}. These updated cells are highlighted in **red**.
* **Change 1 (Trend Verification):** The rule `cell_{6,2} ← 7` is applied. In S_t, cell (6,2) was empty (`-`). In S_{t+1}, cell (6,2) now contains the number **7** (in red).
* **Change 2 (Trend Verification):** The rule `cell_{7,9} ← 2` is applied. In S_t, cell (7,9) contained the number **4**. In S_{t+1}, cell (7,9) now contains the number **2** (in red).
All other numbers in S_{t+1} remain in the exact same positions as in S_t.
### Key Observations
1. **Targeted Update:** The transformation is not a full solve or a random change; it is a precise, rule-based update of two specific cells.
2. **Visual Highlighting:** The diagram uses the color red to draw immediate attention to the modified cells in the output state (S_{t+1}), making the effect of the transformation rule visually explicit.
3. **Process Abstraction:** The symbols `π` and `T` abstract the computational steps. `π` likely represents a policy or function that determines *which* cells to update (generating R_{t+1}), while `T` represents the transition function that *applies* those updates to the state.
4. **State Consistency:** Aside from the two specified changes, the Sudoku grid's state is perfectly preserved, indicating a deterministic and localized update process.
### Interpretation
This diagram models a single, discrete step in a computational process for solving or manipulating a Sudoku puzzle. It exemplifies a **state-transition model** common in reinforcement learning, search algorithms, or constraint satisfaction problems.
* **What it demonstrates:** The process shows how an agent or algorithm (`π`) observes a state (`S_t`), decides on a minimal set of actions (updating two cells to specific values, encoded in `R_{t+1}`), and then executes those actions via a transition function (`T`) to produce a new, slightly more solved state (`S_{t+1}`).
* **Relationship between elements:** The flow is causal and sequential. The initial state is the input. The policy `π` acts as the "brain," generating a compact action plan (`R_{t+1}`). The transition `T` is the "hands" that execute the plan on the environment (the grid). The output is a new state that is one step closer to a complete solution.
* **Notable implications:** The update from 4 to 2 in cell (7,9) suggests the algorithm is correcting a value, possibly because the 4 was a violation of Sudoku rules (e.g., a duplicate in its row, column, or 3x3 box). The insertion of a 7 into an empty cell (6,2) represents filling in a known, deduced value. This two-step action—correcting an error and filling a blank—is a microcosm of the entire solving process. The diagram effectively breaks down the complex task of solving a Sudoku into atomic, understandable operations.