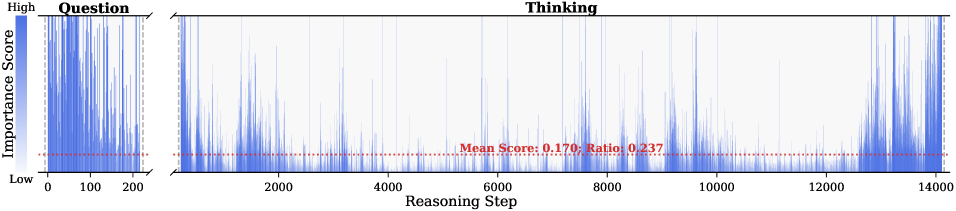
## Chart: Importance Score vs. Reasoning Step for Question and Thinking
### Overview
The image presents a chart comparing the "Importance Score" against the "Reasoning Step" for two phases: "Question" and "Thinking". The chart uses a series of vertical lines to represent the importance score at each reasoning step. A color gradient indicates the importance score, ranging from low (light blue) to high (dark blue). A horizontal dotted red line indicates the mean score and ratio for the "Thinking" phase.
### Components/Axes
* **Title:** "Thinking"
* **X-axis:** "Reasoning Step" (ranging from 0 to 14000)
* **Y-axis:** "Importance Score" (ranging from Low to High)
* **Left Subplot Title:** "Question"
* **Left Subplot X-axis:** Reasoning Step (ranging from 0 to 200)
* **Color Gradient:** Blue, indicating Importance Score (Low to High)
* **Horizontal Red Dotted Line:** Represents the "Mean Score: 0.170; Ratio: 0.237" for the "Thinking" phase.
### Detailed Analysis
**1. Question Phase (Left Subplot):**
* The "Question" phase spans reasoning steps from 0 to 200.
* The importance scores are generally high, with many lines reaching the "High" end of the Importance Score axis.
* The density of lines is greater in the "Question" phase compared to the "Thinking" phase.
* The importance scores appear to decrease slightly as the reasoning step increases from 0 to 200.
**2. Thinking Phase (Main Chart):**
* The "Thinking" phase spans reasoning steps from 0 to 14000.
* The importance scores fluctuate significantly throughout the reasoning steps.
* There are several peaks where the importance scores reach high values, interspersed with periods of lower scores.
* The "Mean Score" is indicated by a horizontal red dotted line at approximately 0.170.
* The "Ratio" is given as 0.237.
**3. Data Points and Trends:**
* **Question Phase:** High initial importance scores that gradually decrease.
* **Thinking Phase:** Fluctuating importance scores with peaks at approximately reasoning steps: 1000, 3000, 5000, 7000, 9000, 11000, 13000.
* The mean score for the "Thinking" phase is 0.170, and the ratio is 0.237.
### Key Observations
* The "Question" phase has a higher overall importance score compared to the "Thinking" phase.
* The "Thinking" phase exhibits cyclical patterns with peaks in importance scores occurring roughly every 2000 reasoning steps.
* The mean score and ratio provide a quantitative measure of the average importance and its distribution during the "Thinking" phase.
### Interpretation
The chart illustrates the dynamics of importance scores during the "Question" and "Thinking" phases of a reasoning process. The high initial importance scores in the "Question" phase suggest that the initial problem formulation or information gathering is considered highly important. The fluctuating importance scores in the "Thinking" phase indicate that the relevance of different reasoning steps varies throughout the problem-solving process. The cyclical peaks in the "Thinking" phase could represent iterative cycles of analysis, hypothesis generation, and evaluation. The mean score and ratio provide a baseline for understanding the overall importance and variability of the reasoning steps in the "Thinking" phase. The difference in importance score between the "Question" and "Thinking" phases suggests a shift in focus from initial information to the reasoning process itself.