## Heatmap/Bar Chart: Importance Score Across Reasoning Steps
### Overview
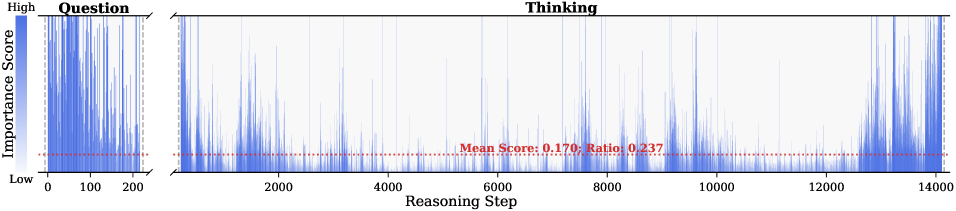
The image displays a two-part chart visualizing the "Importance Score" (vertical axis) across a sequence of "Reasoning Step" (horizontal axis). The chart is split into two distinct panels: a smaller left panel labeled "Question" and a larger right panel labeled "Thinking." A horizontal red dashed line runs across both panels, annotated with a mean score and a ratio. The data is represented by vertical blue bars of varying heights, creating a dense, spike-like pattern.
### Components/Axes
* **Vertical Axis (Y-axis):**
* **Label:** "Importance Score"
* **Scale:** Qualitative, marked from "Low" at the bottom to "High" at the top. No numerical scale is provided.
* **Horizontal Axis (X-axis):**
* **Label:** "Reasoning Step"
* **Scale:** Numerical, linear.
* **Left Panel ("Question"):** Ranges from 0 to 200, with major ticks at 0, 100, and 200.
* **Right Panel ("Thinking"):** Ranges from 0 to 14000, with major ticks at 0, 2000, 4000, 6000, 8000, 10000, 12000, and 14000. A break in the axis (indicated by a zigzag line) separates it from the "Question" panel.
* **Data Series:**
* Represented by vertical blue bars. The height of each bar corresponds to the Importance Score at that specific Reasoning Step.
* **Reference Line:**
* A horizontal red dashed line spans the entire width of both panels.
* **Annotation (Centered on the line in the "Thinking" panel):** "Mean Score: 0.170; Ratio: 0.237"
* **Panel Labels:**
* **Left Panel Title:** "Question" (positioned top-left).
* **Right Panel Title:** "Thinking" (positioned top-center).
### Detailed Analysis
* **"Question" Panel (Steps 0-200):**
* The blue bars are densely packed, indicating data points for nearly every step.
* Bar heights show high variability, with frequent spikes reaching towards the "High" end of the Importance Score axis. There is no clear upward or downward trend; the pattern appears stochastic or bursty.
* **"Thinking" Panel (Steps 0-14000):**
* The blue bars are also dense but appear slightly less packed than in the "Question" panel, possibly due to the compressed horizontal scale.
* The overall trend shows a baseline of low importance scores (bars near the "Low" mark) punctuated by frequent, irregular spikes of higher importance.
* **Notable Trend:** The frequency and magnitude of the high-importance spikes appear to increase in the latter portion of the sequence, particularly from step ~12000 to 14000, where several tall spikes are clustered.
* **Reference Line Data:**
* **Mean Score:** 0.170. This suggests the average importance score across all steps (in both panels) is relatively low on the implied 0-1 scale.
* **Ratio:** 0.237. This likely represents the proportion of steps with an importance score above a certain threshold (possibly the mean itself, or another defined cutoff).
### Key Observations
1. **Bimodal Distribution:** The data suggests a pattern where most reasoning steps have low importance, but a significant minority of steps are assigned high importance.
2. **Phase Comparison:** The "Question" phase (first 200 steps) exhibits intense, concentrated bursts of high importance. The "Thinking" phase (next 14000 steps) shows a more sustained process with sporadic high-importance events that become more frequent towards the end.
3. **Late-Stage Intensification:** The cluster of high spikes between steps 12000 and 14000 in the "Thinking" panel is a prominent visual feature, indicating a period of heightened importance or critical processing near the conclusion of the sequence.
4. **Quantitative Benchmark:** The red line provides a fixed reference. Visually, a large majority of the blue bars fall below this line, consistent with the low mean score of 0.170.
### Interpretation
This chart likely visualizes the internal attention or salience mechanism of an AI model during a complex reasoning task. The "Importance Score" could represent attention weights, gradient magnitudes, or another metric of step significance.
* **What it suggests:** The process is not uniformly important. The model dedicates most of its steps to low-importance processing, interspersed with critical "breakthrough" or "focus" moments (the high spikes). The "Question" phase involves intense, immediate analysis of the input. The extended "Thinking" phase involves a long-tail reasoning process where importance is generally low but punctuated by key insights, with a notable surge in critical activity as the process nears completion (steps 12000-14000).
* **Relationship between elements:** The two panels contrast the initial, concentrated analysis ("Question") with the prolonged, iterative reasoning ("Thinking"). The red mean line acts as a global benchmark, highlighting that high-importance steps are the exception, not the rule.
* **Anomalies/Notable Patterns:** The increasing density of high-importance spikes at the end of the "Thinking" phase is the most significant pattern. It could indicate the model converging on a solution, synthesizing information, or experiencing a cascade of related insights. The ratio of 0.237 quantifies that roughly 23.7% of the steps are considered "important" by the model's own metric, which is a substantial minority for a 14,000-step process.