## Diagram: Grid-Based Path or Matrix with Marked Cells
### Overview
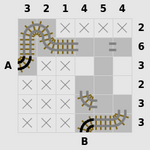
The image displays a 7x7 grid diagram with labeled rows and columns. The grid contains a mix of marked cells (with "X" symbols), shaded gray areas, and two distinct graphical elements resembling segmented, worm-like or snake-like paths located in the top-left and bottom-right corners. The diagram appears to represent a state, a pathfinding problem, or a matrix with specific constraints or highlighted regions.
### Components/Axes
* **Column Headers (Top Row):** The numbers `3`, `2`, `1`, `4`, `5`, `4`, `2` are positioned above the seven columns, from left to right.
* **Row Headers (Left Column):** The labels `A`, `6`, `3`, `2`, `3`, `3`, `B` are positioned to the left of the seven rows, from top to bottom.
* **Grid Cells:** The intersection of each row and column forms a cell. The content of each cell is one of the following:
1. An "X" symbol.
2. A solid light gray shading.
3. Part of a detailed graphical element.
4. Empty (white background).
* **Graphical Elements:**
* **Top-Left Element:** A curved, segmented shape originating near the intersection of row `A` and column `3`. It extends rightwards and downwards, overlapping cells in rows `A` and `6` and columns `3`, `2`, and `1`. It has a detailed, almost skeletal or mechanical texture.
* **Bottom-Right Element:** A similar curved, segmented shape originating near the intersection of row `B` and column `2`. It extends leftwards and upwards, overlapping cells in rows `B` and the row above it (labeled `3`) and columns `2`, `4`, and `5`. Its texture matches the top-left element.
* **Shaded Region:** A contiguous block of light gray shading covers a specific set of cells, forming a rough diagonal or stepped pattern from the upper-middle to the lower-middle of the grid.
### Detailed Analysis
**Grid Content Matrix (Row Label, Column Content from left to right):**
* **Row A:** `[Graphical Element start]`, `[Graphical Element]`, `[Graphical Element]`, `X`, `X`, `X`, `X`
* **Row 6:** `X`, `X`, `[Shaded]`, `[Shaded]`, `X`, `X`, `X`
* **Row 3 (first):** `X`, `[Shaded]`, `[Shaded]`, `[Shaded]`, `[Shaded]`, `X`, `X`
* **Row 2:** `X`, `[Shaded]`, `[Shaded]`, `[Shaded]`, `[Shaded]`, `[Shaded]`, `X`
* **Row 3 (second):** `X`, `X`, `[Shaded]`, `[Shaded]`, `[Shaded]`, `X`, `X`
* **Row 3 (third):** `X`, `X`, `X`, `[Shaded]`, `[Shaded]`, `X`, `X`
* **Row B:** `X`, `X`, `X`, `X`, `[Graphical Element]`, `[Graphical Element]`, `[Graphical Element end]`
**Spatial Grounding of Key Features:**
* The **"X" marks** are predominantly located in the leftmost and rightmost columns, and in the top and bottom rows, forming a rough border around the central shaded area.
* The **shaded gray area** is centrally located, forming a connected region that is widest in the middle rows (rows `2` and the first `3` below it) and narrows towards the top and bottom.
* The **graphical elements** are positioned at opposite corners: one starting at the top-left (Row A, Column 3) and one ending at the bottom-right (Row B, Column 5). They appear to be entering or exiting the grid.
### Key Observations
1. **Symmetry and Pattern:** The grid of "X" marks and shaded cells exhibits approximate vertical symmetry around the central column (column `4`). The pattern of "X"s is not perfectly symmetric but follows a similar density on the left and right flanks.
2. **Path or Obstacle Representation:** The "X" marks likely represent blocked cells, obstacles, or invalid positions. The shaded area could represent a valid path, a region of interest, or a different state. The graphical elements resemble a "snake" or "worm" that might be navigating this grid, with its head/tail at the corners.
3. **Numerical Labels:** The row and column headers are numerical (`2`, `3`, `4`, `5`, `6`) with the exceptions of `A` and `B`, which likely denote start and end points or specific rows of interest. The numbers do not follow a simple sequential order (e.g., columns: 3,2,1,4,5,4,2), suggesting they may be identifiers, weights, or costs rather than simple indices.
4. **No Explicit Legend:** The diagram lacks a formal legend. The meaning of "X", shading, and the graphical elements must be inferred from context, common in puzzles, algorithm visualizations, or state diagrams.
### Interpretation
This diagram is most likely a visualization of a **pathfinding problem, a puzzle state (like Snake or a maze), or a matrix representing a game board or constraint satisfaction problem**.
* **What the data suggests:** The grid defines a space with allowed (shaded/white) and disallowed ("X") cells. The numbers on the axes could represent coordinates, cell values, or movement costs. The two graphical elements strongly imply an agent (a snake, a path, a connection) that exists at the boundaries of this space, potentially needing to traverse the central shaded region.
* **How elements relate:** The "X"s form barriers that channel movement or define the perimeter of the playable/solvable area. The shaded region is the core area of operation. The corner elements (`A` and `B`) are likely the start and end points for a path or the current position of an agent split across the board.
* **Notable anomalies/patterns:** The non-sequential numbering of rows and columns is the most striking feature. It implies the grid is not a simple coordinate system but perhaps a graph where the labels are node identifiers. The perfect connectivity of the shaded region suggests it is a single, contiguous zone of importance. The placement of the graphical elements at `A` and `B` frames the entire grid as a problem to be solved between these two points.
**In essence, the image conveys a structured problem space with clear boundaries (X's), a core operational area (shading), and defined start/end conditions (A, B, and the graphical elements), typical of computational logic puzzles or algorithm demonstrations.**