## Circular Diagram: Math Concepts
### Overview
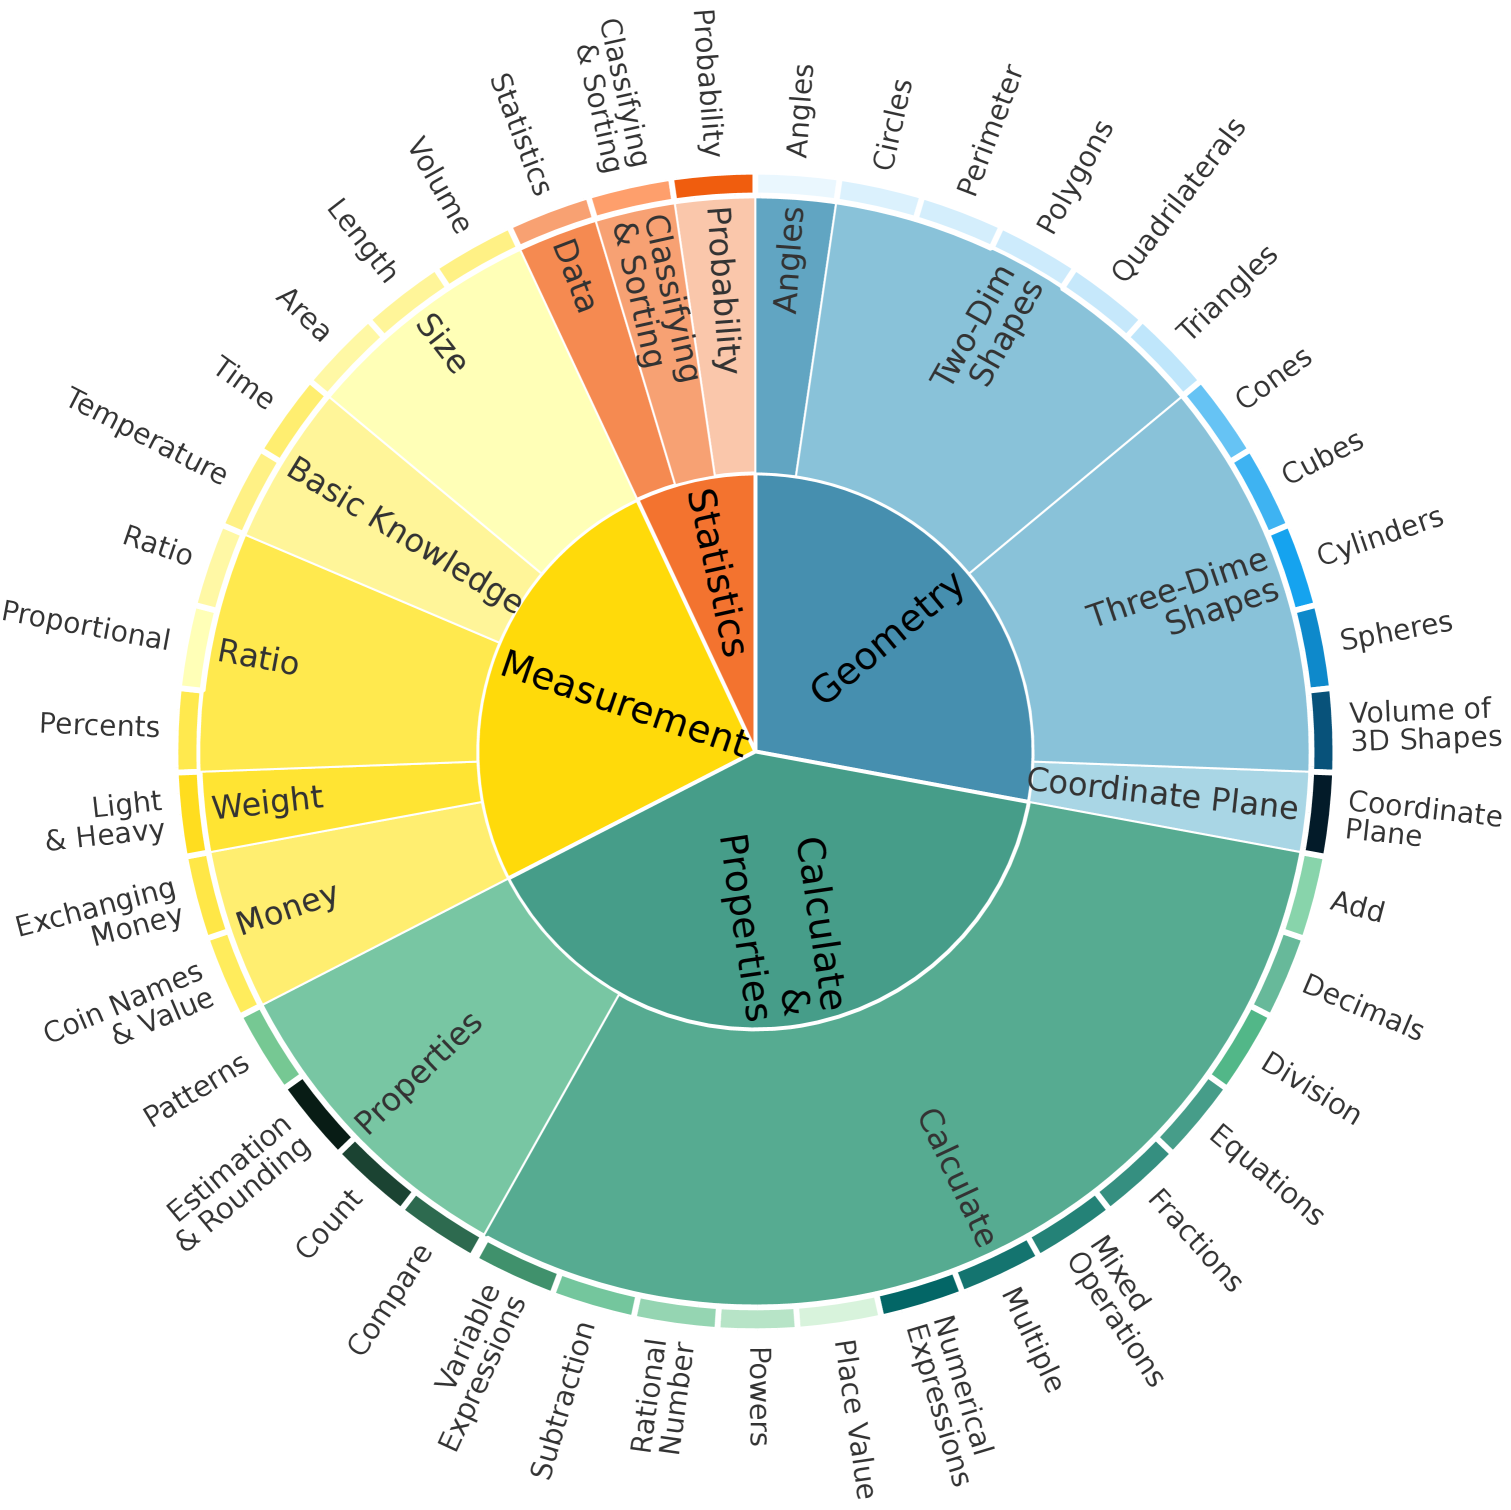
The image is a circular diagram illustrating the relationships between different mathematical concepts. It is structured in concentric rings, with broader categories in the inner rings and more specific subcategories in the outer rings. The diagram uses color-coding to visually group related concepts.
### Components/Axes
* **Center:** Geometry (Dark Teal)
* **Ring 2:**
* Statistics (Orange)
* Measurement (Yellow)
* Calculate & Properties (Green)
* Two-Dim Shapes (Light Blue)
* Three-Dime Shapes (Blue)
* Coordinate Plane (Dark Blue)
* **Outer Ring:**
* **Statistics:** Probability, Classifying & Sorting, Data
* **Measurement:** Volume, Length, Area, Size, Time, Temperature, Ratio, Proportional, Percents, Light & Heavy, Exchanging Money, Coin Names & Value
* **Calculate & Properties:** Patterns, Estimation & Rounding, Count, Compare, Variable Expressions, Subtraction, Rational Number, Powers, Place Value, Numerical Expressions, Multiple Operations
* **Two-Dim Shapes:** Angles, Circles, Perimeter, Polygons, Quadrilaterals, Triangles
* **Three-Dime Shapes:** Cones, Cubes, Cylinders, Spheres, Volume of 3D Shapes
* **Calculate:** Add, Decimals, Division, Equations, Fractions, Mixed Operations
* **Color Coding:**
* Dark Teal: Geometry
* Orange: Statistics
* Yellow: Measurement
* Green: Calculate & Properties
* Light Blue: Two-Dim Shapes
* Blue: Three-Dime Shapes
* Dark Blue: Coordinate Plane
### Detailed Analysis or ### Content Details
* **Geometry:** The central concept, branching out into shapes, statistics, measurement, and calculation.
* **Statistics:** Includes Probability, Classifying & Sorting, and Data.
* **Measurement:** Covers a wide range of concepts, from Volume and Length to Time, Temperature, Ratio, Proportional, Percents, Weight (Light & Heavy), and Money (Exchanging Money, Coin Names & Value).
* **Calculate & Properties:** Encompasses Patterns, Estimation & Rounding, Count, Compare, Variable Expressions, Subtraction, Rational Number, Powers, Place Value, Numerical Expressions, and Multiple Operations.
* **Two-Dim Shapes:** Includes Angles, Circles, Perimeter, Polygons, Quadrilaterals, and Triangles.
* **Three-Dime Shapes:** Includes Cones, Cubes, Cylinders, Spheres, and Volume of 3D Shapes.
* **Coordinate Plane:** Includes Coordinate Plane.
* **Calculate:** Includes Add, Decimals, Division, Equations, Fractions, and Mixed Operations.
### Key Observations
* The diagram provides a hierarchical view of mathematical concepts, starting from the broad category of Geometry and branching out into more specific subcategories.
* The color-coding helps to visually group related concepts, making it easier to understand the relationships between them.
* The diagram covers a wide range of mathematical topics, from basic measurement and calculation to more advanced concepts like statistics and geometry.
### Interpretation
The circular diagram serves as a visual representation of how different mathematical concepts are interconnected. It highlights the central role of Geometry as a foundation for other areas of mathematics. The diagram is useful for understanding the relationships between different topics and for providing a high-level overview of the field of mathematics. The structure suggests a curriculum or a learning path, starting with basic concepts and progressing to more advanced topics. The diagram could be used as a reference tool for students or teachers to understand the scope and structure of mathematics.