## Diagram: Process Flow Diagram
### Overview
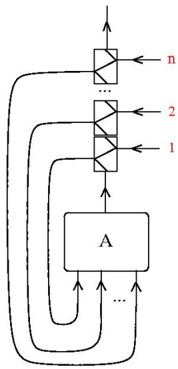
The image is a process flow diagram illustrating a system with multiple inputs feeding into a series of components, culminating in a feedback loop. The diagram includes rectangular boxes representing processing units and arrows indicating the direction of flow.
### Components/Axes
* **Processing Units:** Represented by rectangular boxes. There are multiple boxes stacked vertically at the top and one larger box labeled "A" at the bottom.
* **Inputs:** Arrows pointing into the rectangular boxes on the right side, labeled "1", "2", and "n" in red.
* **Outputs:** Arrows pointing out of the rectangular boxes, indicating the flow of processed material.
* **Feedback Loop:** Curved arrows connecting the output of box "A" back to the inputs of the stacked boxes.
* **Flow Direction:** Indicated by arrows.
### Detailed Analysis
* **Top Stacked Boxes:** There are at least three stacked boxes at the top. The top box is labeled "n" on the right side. The second and third boxes are labeled "2" and "1" respectively, also on the right side. Each box has an input arrow pointing into its right side and an output arrow pointing out of its top.
* **Box A:** Located below the stacked boxes. It has an input arrow pointing into its top and multiple output arrows pointing out of its bottom. The outputs loop back to the inputs of the stacked boxes.
* **Flow:** The flow starts with inputs "1", "2", and "n" entering the stacked boxes. The outputs of these boxes feed into box "A". The outputs of box "A" are then fed back into the inputs of the stacked boxes, creating a feedback loop.
### Key Observations
* The diagram illustrates a system with multiple inputs and a feedback mechanism.
* The stacked boxes at the top appear to be processing units that receive inputs and produce outputs.
* Box "A" seems to be a central processing unit that receives inputs from the stacked boxes and distributes outputs back to them.
* The feedback loop suggests that the system is self-regulating or iterative.
### Interpretation
The diagram represents a process where multiple inputs are processed through a series of stages (the stacked boxes) and then fed into a central unit (box "A"). The outputs of the central unit are then fed back into the initial stages, creating a feedback loop. This type of system could represent a variety of processes, such as a chemical reaction, a control system, or a computational algorithm. The labels "1", "2", and "n" suggest that there are multiple inputs, possibly representing different parameters or variables. The feedback loop indicates that the system is dynamic and can adjust its behavior based on its outputs.