## Dual-Axis Grouped Bar Chart: Accuracy and Trial Numbers across Difficulty Level (Base Model: Qwen2.5-Math-7B)
### Overview
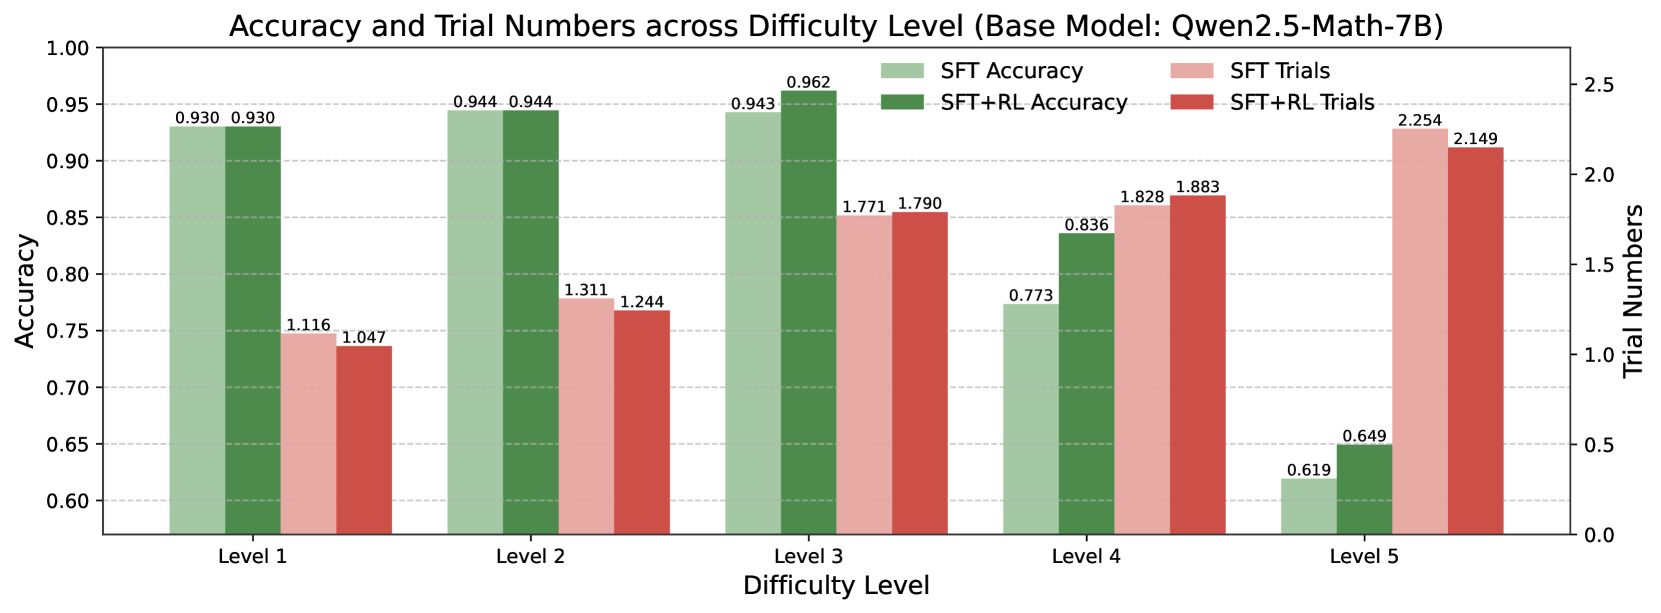
This image is a dual-axis grouped bar chart comparing the performance of two training methods (SFT and SFT+RL) on a base model named "Qwen2.5-Math-7B". The chart evaluates performance across five discrete difficulty levels (Level 1 to Level 5) using two metrics: Accuracy (left y-axis) and Trial Numbers (right y-axis). Each difficulty level has four bars representing the two metrics for the two training methods.
### Components/Axes
* **Chart Title:** "Accuracy and Trial Numbers across Difficulty Level (Base Model: Qwen2.5-Math-7B)"
* **X-Axis (Horizontal):** Labeled "Difficulty Level". It contains five categorical groups: "Level 1", "Level 2", "Level 3", "Level 4", and "Level 5".
* **Primary Y-Axis (Left):** Labeled "Accuracy". It is a linear scale ranging from 0.60 to 1.00, with major gridlines at intervals of 0.05.
* **Secondary Y-Axis (Right):** Labeled "Trial Numbers". It is a linear scale ranging from 0.0 to 2.5, with major gridlines at intervals of 0.5.
* **Legend:** Positioned in the top-right quadrant of the chart area. It defines four data series:
* **SFT Accuracy:** Light green bar.
* **SFT+RL Accuracy:** Dark green bar.
* **SFT Trials:** Light red/pink bar.
* **SFT+RL Trials:** Dark red bar.
* **Data Labels:** Each bar has its exact numerical value displayed directly above it.
### Detailed Analysis
The chart presents the following data points for each difficulty level, grouped by metric and training method:
**Level 1:**
* **Accuracy:** SFT = 0.930, SFT+RL = 0.930 (Identical performance).
* **Trial Numbers:** SFT = 1.116, SFT+RL = 1.047 (SFT+RL requires slightly fewer trials).
**Level 2:**
* **Accuracy:** SFT = 0.944, SFT+RL = 0.944 (Identical performance).
* **Trial Numbers:** SFT = 1.311, SFT+RL = 1.244 (SFT+RL requires fewer trials).
**Level 3:**
* **Accuracy:** SFT = 0.943, SFT+RL = 0.962 (SFT+RL shows a slight improvement).
* **Trial Numbers:** SFT = 1.771, SFT+RL = 1.790 (Trial numbers are very close, with SFT+RL being marginally higher).
**Level 4:**
* **Accuracy:** SFT = 0.773, SFT+RL = 0.836 (SFT+RL shows a notable improvement of ~0.063).
* **Trial Numbers:** SFT = 1.828, SFT+RL = 1.883 (SFT+RL requires slightly more trials).
**Level 5:**
* **Accuracy:** SFT = 0.619, SFT+RL = 0.649 (SFT+RL shows a moderate improvement of 0.030).
* **Trial Numbers:** SFT = 2.254, SFT+RL = 2.149 (SFT+RL requires fewer trials).
**Visual Trends:**
1. **Accuracy Trend (Green Bars):** For both methods, accuracy generally decreases as difficulty increases from Level 3 to Level 5. Levels 1-3 maintain high accuracy (>0.93), with a sharp drop at Level 4 and a further drop at Level 5.
2. **Trial Numbers Trend (Red Bars):** For both methods, the number of trials required increases steadily with difficulty level, from ~1.1 at Level 1 to over 2.1 at Level 5.
3. **Method Comparison:** The SFT+RL method (dark green/dark red) consistently matches or outperforms the SFT method (light green/light red) in accuracy, with the most significant advantage at Level 4. The trial numbers for the two methods are closely matched, with no consistent pattern of one requiring significantly more trials than the other across all levels.
### Key Observations
* **Performance Plateau and Drop:** The model achieves near-identical, high accuracy on Levels 1-3, suggesting these difficulty levels are within the model's strong capability range. The significant performance drop at Level 4 indicates a substantial increase in problem complexity that challenges the model.
* **RL Benefit at Critical Point:** The reinforcement learning (RL) component provides the most clear accuracy benefit at Level 4, the point where base performance drops significantly. This suggests RL may help the model generalize or apply its knowledge more effectively to harder problems.
* **Trial Cost Correlates with Difficulty:** The near-linear increase in trial numbers with difficulty level indicates that harder problems require more attempts to solve, regardless of the training method.
* **Anomaly at Level 3 Trials:** While accuracy is very high and similar for both methods at Level 3, the trial numbers (1.771 and 1.790) are notably higher than at Level 2 (~1.3). This suggests Level 3 problems, while still solvable with high accuracy, may require more exploratory attempts.
### Interpretation
This chart demonstrates the trade-off between problem difficulty, solution accuracy, and computational effort (trials) for a math-focused language model. The data suggests that:
1. **The base model (Qwen2.5-Math-7B) has a clear capability threshold.** It performs robustly on Levels 1-3 but struggles significantly with Level 4 and above, indicating these levels likely involve more advanced mathematical reasoning or multi-step processes.
2. **Supervised Fine-Tuning (SFT) alone is sufficient for easier problems** (Levels 1-3), achieving high accuracy. Adding Reinforcement Learning (SFT+RL) provides marginal to no accuracy benefit on these levels but does not significantly increase the trial cost.
3. **Reinforcement Learning shows its value at the model's performance edge.** The most pronounced accuracy gain from RL occurs at Level 4, where the model's base performance falters. This implies RL training helps refine the model's decision-making or strategy selection when faced with challenging, but not impossible, problems.
4. **Increased difficulty universally demands more resources.** The consistent rise in trial numbers underscores that harder problems are not just less likely to be solved correctly, but are also more computationally expensive to attempt, regardless of the training paradigm.
In essence, the visualization argues that while SFT establishes a strong foundation, targeted RL can provide a crucial performance boost precisely where the model begins to fail, making it a valuable tool for extending a model's effective difficulty range.