## Diagram: Data Pipelines
### Overview
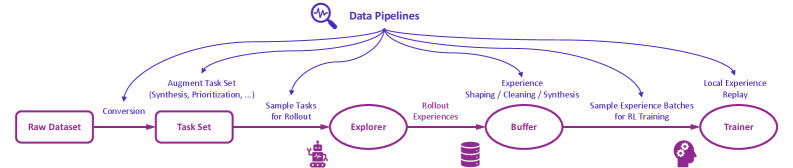
The image is a diagram illustrating data pipelines for reinforcement learning (RL) training. It shows the flow of data from a raw dataset through various stages, including task set creation, exploration, buffering, and training. The diagram uses purple lines and text to represent the data flow and processes.
### Components/Axes
* **Title:** Data Pipelines (located at the top-center of the image, accompanied by a magnifying glass icon with a waveform inside)
* **Nodes (from left to right):**
* Raw Dataset (rectangle)
* Task Set (rectangle)
* Explorer (oval) - with a robot icon below
* Buffer (oval) - with a database icon below
* Trainer (oval) - with a head icon with gears below
* **Edges (data flow):** Arrows connecting the nodes, labeled with descriptions of the processes.
* **Data Pipeline Branches:** Arcs originating from "Data Pipelines" and pointing towards the nodes.
### Detailed Analysis
* **Raw Dataset:** The starting point of the pipeline.
* **Conversion:** The process of converting the raw dataset into a task set.
* **Task Set:** A set of tasks derived from the raw dataset.
* **Augment Task Set (Synthesis, Prioritization, ...):** A data pipeline branch pointing to the Task Set. This indicates that the task set can be augmented through synthesis and prioritization.
* **Sample Tasks for Rollout:** The process of sampling tasks from the task set for rollout.
* **Explorer:** An agent or system that explores the environment based on the sampled tasks. A robot icon is placed below the Explorer node.
* **Rollout Experiences:** The experiences generated by the explorer during rollout.
* **Buffer:** A storage area for the rollout experiences. A database icon is placed below the Buffer node.
* **Experience Shaping / Cleaning / Synthesis:** A data pipeline branch pointing to the Buffer. This indicates that the experiences in the buffer can be shaped, cleaned, and synthesized.
* **Sample Experience Batches for RL Training:** The process of sampling batches of experiences from the buffer for RL training.
* **Trainer:** The RL training component that learns from the sampled experience batches. A head icon with gears is placed below the Trainer node.
* **Local Experience Replay:** A data pipeline branch pointing to the Trainer. This indicates that the trainer uses local experience replay.
### Key Observations
* The diagram illustrates a sequential flow of data from the Raw Dataset to the Trainer.
* There are multiple data pipeline branches originating from the "Data Pipelines" title, indicating different processes that can influence the data at various stages.
* The icons below the Explorer, Buffer, and Trainer nodes provide visual cues about the nature of these components.
### Interpretation
The diagram depicts a typical data pipeline used in reinforcement learning. It highlights the key stages involved in preparing and using data for training an RL agent. The data pipeline branches suggest that there are opportunities for data augmentation, experience shaping, and local experience replay, which can improve the efficiency and effectiveness of the RL training process. The diagram emphasizes the importance of data management and processing in RL, as the quality and diversity of the data directly impact the performance of the trained agent.