## Line Chart: R1-Llama | GK23EN
### Overview
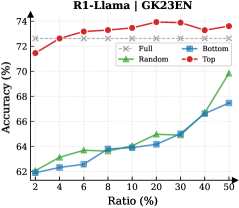
The image is a line chart comparing the accuracy (%) of different models (Full, Random, Bottom, Top) against the ratio (%) on the x-axis. The chart shows how the accuracy changes as the ratio increases for each model.
### Components/Axes
* **Title:** R1-Llama | GK23EN
* **X-axis:** Ratio (%) with markers at 2, 4, 6, 8, 10, 20, 30, 40, 50
* **Y-axis:** Accuracy (%) with markers at 62, 64, 66, 68, 70, 72, 74
* **Legend:** Located at the top-right of the chart.
* Full (gray dashed line with x markers)
* Random (green line with triangle markers)
* Bottom (blue line with square markers)
* Top (red line with circle markers)
### Detailed Analysis
* **Full:** The gray dashed line with 'x' markers remains relatively constant at approximately 72.7% accuracy across all ratios.
* **Random:** The green line with triangle markers shows an increasing trend.
* At Ratio 2%, accuracy is approximately 62%.
* At Ratio 50%, accuracy is approximately 70%.
* **Bottom:** The blue line with square markers shows an increasing trend.
* At Ratio 2%, accuracy is approximately 62%.
* At Ratio 50%, accuracy is approximately 67.5%.
* **Top:** The red line with circle markers starts high and plateaus.
* At Ratio 2%, accuracy is approximately 71.5%.
* It increases to approximately 73% around Ratio 6%.
* It remains relatively constant around 73% until Ratio 50%.
### Key Observations
* The "Full" model has a consistent accuracy across all ratios.
* The "Top" model has the highest accuracy overall.
* The "Random" and "Bottom" models show increasing accuracy as the ratio increases.
### Interpretation
The chart compares the performance of different models (Full, Random, Bottom, Top) in terms of accuracy as the ratio changes. The "Full" model serves as a baseline, maintaining a stable accuracy. The "Top" model consistently outperforms the others. The "Random" and "Bottom" models improve in accuracy as the ratio increases, suggesting that their performance is influenced by the ratio parameter. The "Top" model's high initial accuracy and plateau indicate that it might be less sensitive to changes in the ratio compared to the "Random" and "Bottom" models.