## Relational Algebra and Dependency Diagrams
### Overview
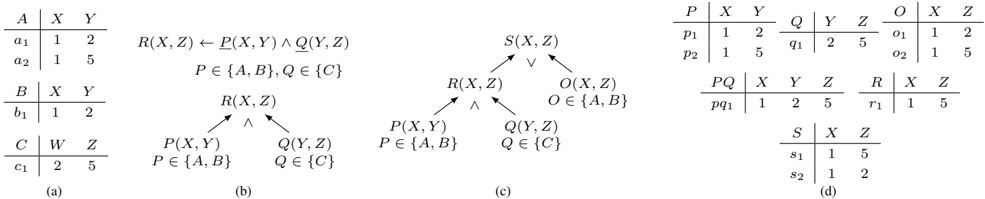
The image presents a series of relational algebra expressions and corresponding dependency diagrams, along with example data tables. It illustrates how relations can be derived from other relations using logical operations like conjunction (AND) and disjunction (OR).
### Components/Axes
* **(a)**: Initial Data Tables:
* Table A: Columns X, Y; Rows (a1: 1, 2), (a2: 1, 5)
* Table B: Columns X, Y; Rows (b1: 1, 2)
* Table C: Columns W, Z; Rows (c1: 2, 5)
* **(b)**: Dependency Diagram 1:
* Expression: R(X, Z) ← P(X, Y) ∧ Q(Y, Z), where P ∈ {A, B}, Q ∈ {C}
* Diagram: R(X, Z) depends on P(X, Y) and Q(Y, Z)
* **(c)**: Dependency Diagram 2:
* Expression: S(X, Z) depends on R(X, Z) ∨ O(X, Z), where O ∈ {A, B}
* Diagram: S(X, Z) depends on R(X, Z) and O(X, Z); R(X, Z) depends on P(X, Y) and Q(Y, Z)
* **(d)**: Derived Data Tables:
* Table P: Columns X, Y; Rows (p1: 1, 2), (p2: 1, 5)
* Table Q: Columns Y, Z; Rows (q1: 2, 5)
* Table O: Columns X, Z; Rows (o1: 1, 2), (o2: 1, 5)
* Table PQ: Columns X, Y, Z; Rows (pq1: 1, 2, 5)
* Table R: Columns X, Z; Rows (r1: 1, 5)
* Table S: Columns X, Z; Rows (s1: 1, 5), (s2: 1, 2)
### Detailed Analysis or ### Content Details
**Section (a): Initial Data Tables**
* **Table A:**
* Column X: Contains the value 1 in both rows.
* Column Y: Contains the values 2 and 5.
* **Table B:**
* Column X: Contains the value 1.
* Column Y: Contains the value 2.
* **Table C:**
* Column W: Contains the value 2.
* Column Z: Contains the value 5.
**Section (b): Dependency Diagram 1**
* The expression `R(X, Z) ← P(X, Y) ∧ Q(Y, Z)` indicates that relation R is derived from the conjunction (AND) of relations P and Q.
* P can be either relation A or B, and Q must be relation C.
* The diagram visually represents this dependency, with R(X, Z) at the top and P(X, Y) and Q(Y, Z) as its dependencies.
**Section (c): Dependency Diagram 2**
* The expression for S(X, Z) involves a disjunction (OR) with R(X, Z) and O(X, Z), where O can be either A or B.
* The diagram shows S(X, Z) depending on R(X, Z) and O(X, Z). R(X, Z) further depends on P(X, Y) and Q(Y, Z), similar to diagram (b).
**Section (d): Derived Data Tables**
* **Table P:**
* Column X: Contains the value 1 in both rows.
* Column Y: Contains the values 2 and 5.
* **Table Q:**
* Column Y: Contains the value 2.
* Column Z: Contains the value 5.
* **Table O:**
* Column X: Contains the value 1 in both rows.
* Column Z: Contains the values 2 and 5.
* **Table PQ:**
* Column X: Contains the value 1.
* Column Y: Contains the value 2.
* Column Z: Contains the value 5.
* **Table R:**
* Column X: Contains the value 1.
* Column Z: Contains the value 5.
* **Table S:**
* Column X: Contains the value 1 in both rows.
* Column Z: Contains the values 5 and 2.
### Key Observations
* The diagrams illustrate how complex relations can be built from simpler ones using logical operations.
* The data tables provide concrete examples of the relations and their contents.
* The choice of P and Q in the expressions affects the resulting data in R and S.
### Interpretation
The image demonstrates the fundamental concepts of relational algebra and data dependencies. It shows how new relations can be derived from existing ones using logical operations like AND and OR. The dependency diagrams provide a visual representation of these relationships, making it easier to understand the flow of data and the dependencies between relations. The data tables provide concrete examples of the relations and their contents, illustrating how the logical operations affect the resulting data. The example shows how the relations are built up from the base relations A, B, and C.