\n
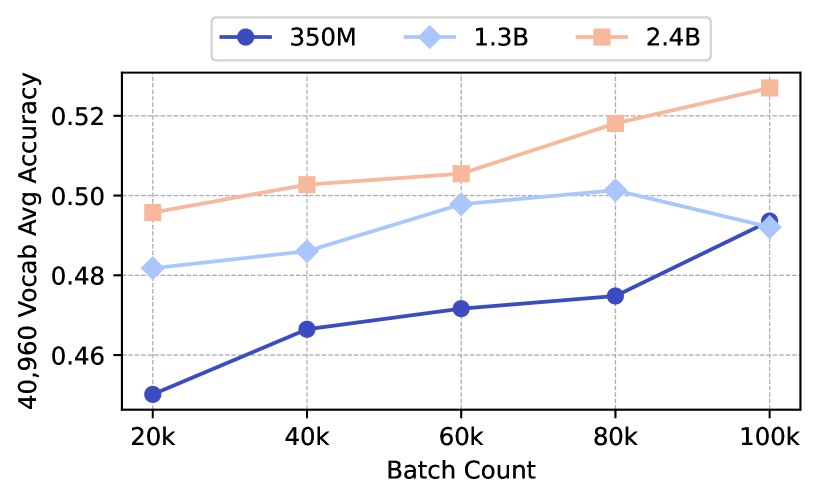
## Line Chart: Model Accuracy vs. Batch Count
### Overview
This image is a line chart comparing the performance of three different model sizes (350M, 1.3B, and 2.4B parameters) as a function of training batch count. The chart plots "40,960 Vocab Avg Accuracy" on the y-axis against "Batch Count" on the x-axis. The data suggests that larger models achieve higher accuracy and that accuracy generally improves with more training batches, though the rate of improvement varies.
### Components/Axes
* **Chart Type:** Line chart with markers.
* **X-Axis:**
* **Label:** "Batch Count"
* **Scale:** Linear scale with major tick marks at 20k, 40k, 60k, 80k, and 100k.
* **Y-Axis:**
* **Label:** "40,960 Vocab Avg Accuracy"
* **Scale:** Linear scale ranging from approximately 0.45 to 0.53, with major tick marks at 0.46, 0.48, 0.50, and 0.52.
* **Legend:** Positioned at the top center of the chart area.
* **350M:** Dark blue line with solid circle markers.
* **1.3B:** Light blue line with diamond markers.
* **2.4B:** Orange line with square markers.
* **Grid:** Light gray dashed grid lines are present for both major x and y-axis ticks.
### Detailed Analysis
**Data Series and Trends:**
1. **350M Model (Dark Blue, Circles):**
* **Trend:** Shows a consistent, moderately steep upward slope across all batch counts.
* **Data Points (Approximate):**
* 20k batches: ~0.450
* 40k batches: ~0.467
* 60k batches: ~0.472
* 80k batches: ~0.475
* 100k batches: ~0.493
2. **1.3B Model (Light Blue, Diamonds):**
* **Trend:** Increases steadily from 20k to 80k batches, then shows a slight decrease or plateau between 80k and 100k batches.
* **Data Points (Approximate):**
* 20k batches: ~0.482
* 40k batches: ~0.486
* 60k batches: ~0.498
* 80k batches: ~0.501
* 100k batches: ~0.492
3. **2.4B Model (Orange, Squares):**
* **Trend:** Exhibits the steepest and most consistent upward trend, maintaining the highest accuracy at every measured batch count.
* **Data Points (Approximate):**
* 20k batches: ~0.495
* 40k batches: ~0.503
* 60k batches: ~0.506
* 80k batches: ~0.518
* 100k batches: ~0.527
### Key Observations
* **Model Size Hierarchy:** There is a clear and consistent hierarchy in performance: 2.4B > 1.3B > 350M at all batch counts.
* **Convergence at 100k:** The performance gap between the 350M and 1.3B models narrows significantly at 100k batches, with the 350M model nearly catching up to the 1.3B model's score.
* **Diminishing Returns/Plateau:** The 1.3B model's performance appears to plateau or slightly regress after 80k batches, while the 2.4B model continues to improve strongly.
* **Relative Improvement:** The 350M model shows the largest relative improvement from its starting point (~9.6% increase from 20k to 100k), while the 2.4B model shows the largest absolute gain (~0.032 points).
### Interpretation
The chart demonstrates the principle of scaling laws in machine learning model training. Larger models (2.4B parameters) not only start at a higher accuracy but also continue to benefit more from extended training (increased batch count) compared to smaller models. The 1.3B model's plateau suggests it may have reached its capacity limit for this specific task and dataset at around 80k batches, or that further training without other adjustments (like learning rate decay) is not beneficial. The near-convergence of the 350M and 1.3B models at 100k batches is an interesting anomaly; it could indicate that the smaller model, given sufficient training time, can approach the performance of a moderately larger model on this specific metric, or it could be a point of measurement variance. Overall, the data strongly supports investing in both larger model sizes and longer training schedules for maximizing accuracy on this 40,960 vocabulary task.