## Line Chart: Model Performance on ARC and DROP Benchmarks
### Overview
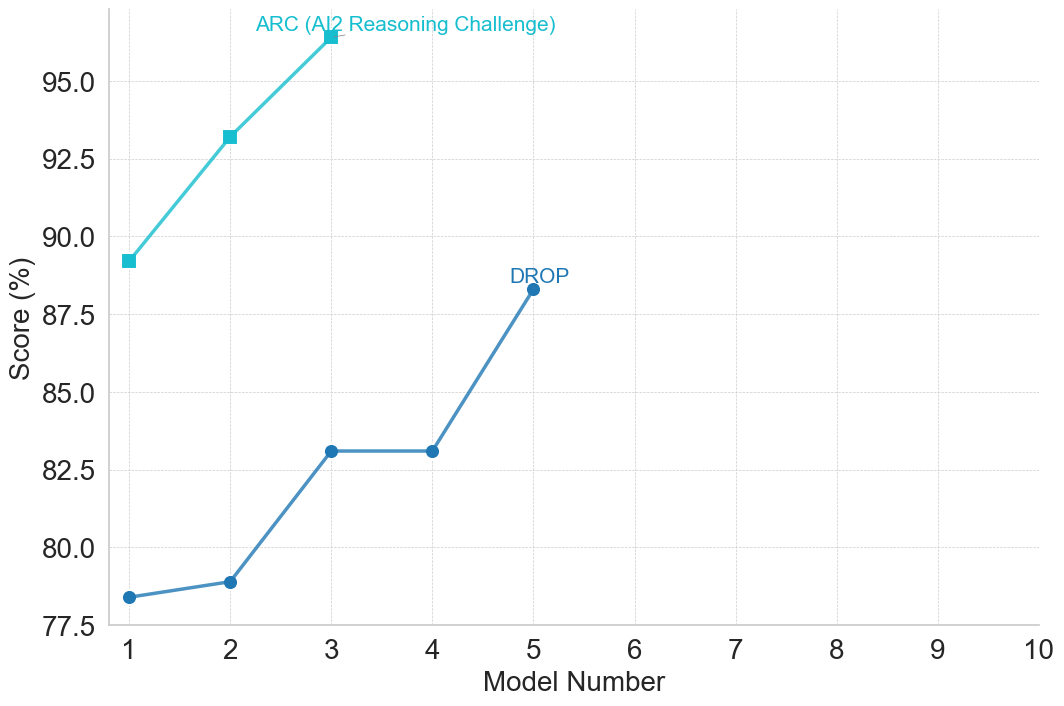
The image displays a line chart comparing the performance scores (in percentage) of sequential model numbers on two distinct benchmarks: ARC (AI2 Reasoning Challenge) and DROP. The chart plots scores against model numbers, showing performance trends for each benchmark across five models (Model 1 to Model 5). The x-axis extends to Model 10, but data is only plotted for the first five models.
### Components/Axes
* **Chart Type:** Line chart with markers.
* **X-Axis:**
* **Label:** "Model Number"
* **Scale:** Linear, from 1 to 10, with major tick marks at every integer.
* **Y-Axis:**
* **Label:** "Score (%)"
* **Scale:** Linear, from 77.5 to 95.0, with major tick marks every 2.5 units (77.5, 80.0, 82.5, 85.0, 87.5, 90.0, 92.5, 95.0).
* **Legend:**
* **Position:** Top-center of the chart area.
* **Series 1:** "ARC (AI2 Reasoning Challenge)" - Represented by a cyan line with square markers.
* **Series 2:** "DROP" - Represented by a blue line with circle markers.
* **Grid:** Light gray horizontal grid lines are present at each major y-axis tick.
### Detailed Analysis
**Data Series 1: ARC (AI2 Reasoning Challenge)**
* **Visual Trend:** The line shows a steep, consistent upward slope from Model 1 to Model 3.
* **Data Points (Approximate):**
* Model 1: ~89.2%
* Model 2: ~93.2%
* Model 3: ~96.5%
* **Note:** Data for Models 4 and 5 is not plotted for the ARC series.
**Data Series 2: DROP**
* **Visual Trend:** The line shows a gradual initial increase, a sharp rise, a plateau, and then another increase.
* **Data Points (Approximate):**
* Model 1: ~78.4%
* Model 2: ~78.8%
* Model 3: ~83.1%
* Model 4: ~83.1% (plateau from Model 3)
* Model 5: ~88.3%
### Key Observations
1. **Performance Gap:** The ARC scores are consistently and significantly higher than the DROP scores for all models where both are plotted (Models 1-3). The gap is approximately 10.8 percentage points at Model 1 and narrows slightly to about 13.4 percentage points at Model 3.
2. **Growth Rates:** The ARC series exhibits a very high growth rate between Models 1 and 2 (~4.0 percentage points). The DROP series shows its most significant single jump between Models 4 and 5 (~5.2 percentage points).
3. **Plateau:** The DROP series shows no improvement between Model 3 and Model 4, holding steady at approximately 83.1%.
4. **Missing Data:** The chart's x-axis is prepared for 10 models, but data is only provided for the first five. The ARC series is missing data for Models 4 and 5.
### Interpretation
This chart visualizes the progression of model capabilities on two challenging reasoning benchmarks. The data suggests that the models evaluated have achieved substantially higher proficiency on the ARC benchmark compared to the DROP benchmark within the first three iterations. The steep, uninterrupted climb in ARC scores indicates rapid and effective optimization for that specific type of challenge.
The DROP performance trajectory is more complex. The initial slow growth, followed by a sharp rise and a plateau, could indicate a period of architectural or training stagnation (Models 2-4) before a breakthrough or the application of a new technique led to the significant gain at Model 5. The plateau at Models 3 and 4 is a notable anomaly, suggesting a temporary performance ceiling was hit for the DROP task.
The absence of data for later models (6-10) and for ARC beyond Model 3 limits the analysis. It is unclear if the trends continued, if the models were evaluated on other benchmarks, or if development shifted focus. The chart effectively demonstrates that model improvement is not uniform across different types of cognitive challenges, highlighting the importance of multi-benchmark evaluation.