## Chart Type: Multiple Line Graphs
### Overview
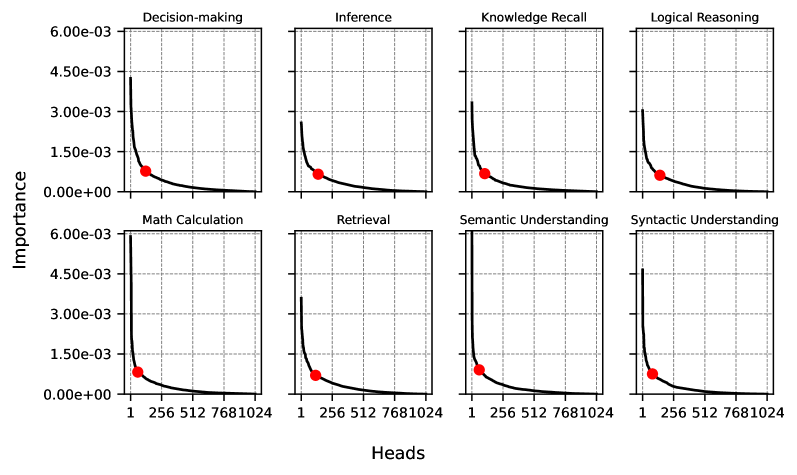
The image contains eight line graphs arranged in a 2x4 grid. Each graph displays the relationship between "Heads" (x-axis) and "Importance" (y-axis) for a specific cognitive task. The cognitive tasks are: Decision-making, Inference, Knowledge Recall, Logical Reasoning, Math Calculation, Retrieval, Semantic Understanding, and Syntactic Understanding. Each graph shows a decreasing trend in importance as the number of heads increases. A red dot is present on each line, marking a specific point on the curve.
### Components/Axes
* **X-axis (Horizontal):** "Heads" with values 1, 256, 512, 768, and 1024. The scale is non-linear.
* **Y-axis (Vertical):** "Importance" with values 0.00e+00, 1.50e-03, 3.00e-03, 4.50e-03, and 6.00e-03.
* **Titles:** Each graph has a title indicating the cognitive task: Decision-making, Inference, Knowledge Recall, Logical Reasoning, Math Calculation, Retrieval, Semantic Understanding, and Syntactic Understanding.
* **Grid:** Each graph has a grid of dashed lines.
* **Data Series:** Each graph contains a single black line representing the relationship between "Heads" and "Importance".
* **Red Dot:** Each graph has a red dot on the black line. The x-coordinate of the red dot is approximately 256.
### Detailed Analysis
**Graph 1: Decision-making**
* Trend: The black line slopes downward, indicating decreasing importance as the number of heads increases.
* Red Dot: Located at approximately (256, 1.25e-03).
**Graph 2: Inference**
* Trend: The black line slopes downward, indicating decreasing importance as the number of heads increases.
* Red Dot: Located at approximately (256, 1.10e-03).
**Graph 3: Knowledge Recall**
* Trend: The black line slopes downward, indicating decreasing importance as the number of heads increases.
* Red Dot: Located at approximately (256, 1.00e-03).
**Graph 4: Logical Reasoning**
* Trend: The black line slopes downward, indicating decreasing importance as the number of heads increases.
* Red Dot: Located at approximately (256, 1.15e-03).
**Graph 5: Math Calculation**
* Trend: The black line slopes downward, indicating decreasing importance as the number of heads increases.
* Red Dot: Located at approximately (256, 0.90e-03).
**Graph 6: Retrieval**
* Trend: The black line slopes downward, indicating decreasing importance as the number of heads increases.
* Red Dot: Located at approximately (256, 0.85e-03).
**Graph 7: Semantic Understanding**
* Trend: The black line slopes downward, indicating decreasing importance as the number of heads increases.
* Red Dot: Located at approximately (256, 0.80e-03).
**Graph 8: Syntactic Understanding**
* Trend: The black line slopes downward, indicating decreasing importance as the number of heads increases.
* Red Dot: Located at approximately (256, 0.75e-03).
### Key Observations
* All graphs exhibit a similar decreasing trend.
* The "Importance" values are relatively high when the number of "Heads" is low (close to 1) and decrease rapidly as the number of "Heads" increases.
* The red dots are consistently positioned around x=256, but the y-values (Importance) vary slightly across the different cognitive tasks.
* The y-axis scale is consistent across all graphs, allowing for direct comparison of "Importance" values.
### Interpretation
The graphs suggest that for all the cognitive tasks examined (Decision-making, Inference, Knowledge Recall, Logical Reasoning, Math Calculation, Retrieval, Semantic Understanding, and Syntactic Understanding), the "Importance" decreases as the number of "Heads" increases. The red dots highlight a specific point (Heads = 256) where the "Importance" values can be compared across the different tasks. The variation in "Importance" at this point suggests that some cognitive tasks may rely more heavily on a smaller number of heads than others. The rapid decrease in "Importance" with increasing "Heads" implies diminishing returns, suggesting that beyond a certain number of heads, the contribution to the task becomes marginal.