TECHNICAL ASSET FINGERPRINT
dc4166b4b45bc26d510abe3d
Click to view fullscreen
Press ESC or click to close
FOUND IN PAPERS
EXPERT: healer-alpha-free VERSION 1
RUNTIME: free/openrouter/healer-alpha
INTEL_VERIFIED
\n
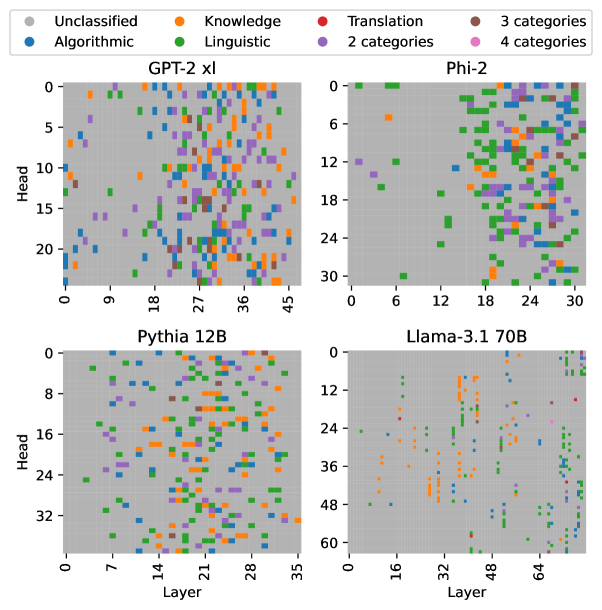
## Scatter Plot Matrix: Attention Head Specialization Across Language Models
### Overview
The image displays a 2x2 grid of scatter plots, each visualizing the functional specialization of attention heads across layers for four different large language models (LLMs). The plots use a color-coded legend to categorize heads based on their primary function or the number of functional categories they are associated with.
### Components/Axes
* **Legend (Top Center):** Positioned above the four plots, it defines eight categories with associated colors:
* **Unclassified:** Gray
* **Knowledge:** Orange
* **Translation:** Red
* **3 categories:** Brown
* **Algorithmic:** Blue
* **Linguistic:** Green
* **2 categories:** Purple
* **4 categories:** Pink
* **Plot Titles (Top of each subplot):**
* Top-Left: `GPT-2 xl`
* Top-Right: `Phi-2`
* Bottom-Left: `Pythia 12B`
* Bottom-Right: `Llama-3.1 70B`
* **Axes (For all plots):**
* **X-axis:** Labeled `Layer`. Represents the transformer layer index, starting from 0.
* **Y-axis:** Labeled `Head`. Represents the attention head index within a layer, starting from 0.
* **Data Points:** Each colored dot represents a single attention head at a specific (Layer, Head) coordinate. The color indicates its functional classification.
### Detailed Analysis
**1. GPT-2 xl (Top-Left Plot)**
* **Axes Range:** Layer (X): 0 to 45. Head (Y): 0 to 20.
* **Data Distribution:** A dense, relatively uniform scattering of points across the entire grid. There is a slight concentration of points in the middle layers (approx. 18-36).
* **Category Prevalence:** Green (Linguistic) and Orange (Knowledge) dots are the most frequent and are distributed widely. Purple (2 categories) dots are also common. Blue (Algorithmic) dots are present but less frequent. Red (Translation) and Brown (3 categories) dots are sparse. No Pink (4 categories) dots are visibly apparent.
**2. Phi-2 (Top-Right Plot)**
* **Axes Range:** Layer (X): 0 to 30. Head (Y): 0 to 30.
* **Data Distribution:** Points are less dense than in GPT-2 xl. There is a notable cluster of points in the upper-right quadrant (higher layers, higher head indices). The lower-left quadrant (early layers, low head indices) is relatively sparse.
* **Category Prevalence:** Green (Linguistic) dots are dominant, especially in the higher layers. Orange (Knowledge) and Purple (2 categories) dots are also present. Blue (Algorithmic) dots are scattered. A few Brown (3 categories) dots are visible.
**3. Pythia 12B (Bottom-Left Plot)**
* **Axes Range:** Layer (X): 0 to 35. Head (Y): 0 to 32.
* **Data Distribution:** Shows a moderate density of points. There appears to be a slight diagonal trend from the bottom-left to the top-right, suggesting heads in later layers might have higher indices, though this is not a strict rule.
* **Category Prevalence:** Orange (Knowledge) dots are very prominent, forming distinct vertical streaks in some layers (e.g., around layers 14-21). Green (Linguistic) and Purple (2 categories) dots are also abundant. Blue (Algorithmic) dots are present. A few Red (Translation) dots can be seen.
**4. Llama-3.1 70B (Bottom-Right Plot)**
* **Axes Range:** Layer (X): 0 to 64. Head (Y): 0 to 60.
* **Data Distribution:** This plot has the sparsest distribution of points. The data is not uniformly scattered; instead, it forms distinct vertical lines or clusters at specific layer intervals (e.g., near layers 16, 32, 48, 64). Many layers appear to have no classified heads.
* **Category Prevalence:** Orange (Knowledge) and Green (Linguistic) dots are the most common within the active clusters. Blue (Algorithmic) dots are also present. Purple (2 categories) dots are less frequent. The overall number of classified heads appears lower relative to the model's size (64 layers, 60 heads per layer).
### Key Observations
1. **Model-Specific Patterns:** Each model exhibits a unique "fingerprint" of head specialization. GPT-2 xl shows dense, widespread classification. Phi-2 has a concentration in later layers. Pythia 12B shows strong vertical banding for Knowledge heads. Llama-3.1 70B displays sparse, clustered activation.
2. **Dominant Functions:** Across all models, heads classified as **Linguistic (Green)** and **Knowledge (Orange)** are the most prevalent, suggesting these are core, widely distributed functions.
3. **Multi-Category Heads:** Heads classified into multiple categories (Purple: 2, Brown: 3) are present in all models but are less common than single-category heads. No heads clearly classified into 4 categories (Pink) are visible.
4. **Scale vs. Density:** The largest model (Llama-3.1 70B) does not have the highest density of classified heads. Its pattern is more specialized and clustered compared to the more uniformly distributed classifications in the smaller models.
### Interpretation
This visualization provides a comparative map of how different LLMs allocate their attention resources. The data suggests that:
* **Functional Specialization is Heterogeneous:** There is no universal blueprint for how attention heads are organized. Architectural differences (model size, training data, objective) lead to divergent internal organization strategies.
* **Core vs. Specialized Functions:** The prevalence of Linguistic and Knowledge heads across models indicates these are fundamental capabilities required for language modeling. The more sporadic appearance of Translation and Algorithmic heads suggests these might be more specialized or emergent functions.
* **Efficiency and Clustering:** The sparse, clustered pattern in Llama-3.1 70B could indicate a more efficient or modular organization, where specific capabilities are localized to particular network regions, as opposed to a diffuse distribution. The vertical streaks in Pythia 12B suggest entire layers may be dedicated to specific functions like Knowledge retrieval.
* **Investigative Insight:** This type of analysis moves beyond treating LLMs as black boxes. By mapping functional anatomy, researchers can hypothesize about model robustness, interpretability, and how capabilities like in-context learning or factual recall might be mechanistically implemented. The differences invite questions about whether one organizational pattern is more advantageous for specific tasks.
DECODING INTELLIGENCE...