## Diagram: Knowledge Graph Reasoning Process
### Overview
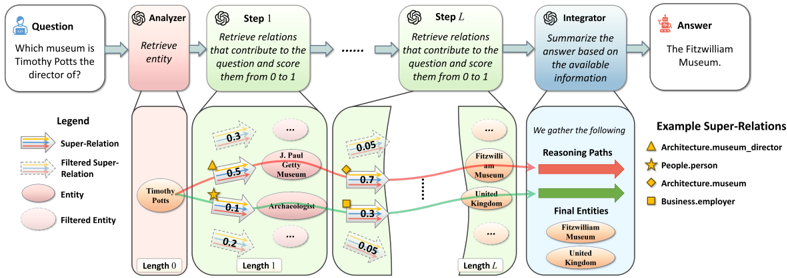
This diagram illustrates a multi-step process for answering a question using a knowledge graph. The process involves an Analyzer, multiple Reasoning Steps (Step 1 to Step L), an Integrator, and ultimately provides an Answer. The diagram visually represents the flow of information and relationships between entities within the knowledge graph.
### Components/Axes
The diagram is structured horizontally, representing a sequential process. Key components include:
* **Question:** "Which museum is Timothy Potts the director of?" (Top-left, within a speech bubble)
* **Analyzer:** A box labeled "Analyzer" with the text "Retrieve relations that contribute to the entity question and score them from 0 to 1".
* **Step 1 to Step L:** Multiple boxes labeled "Step 1" through "Step L", each containing a knowledge graph fragment and the text "Retrieve relations that contribute to the question and score them from 0 to 1".
* **Integrator:** A box labeled "Integrator" with the text "Summarize the answer based on the available information".
* **Answer:** "The Fitzwilliam Museum." (Top-right, within a speech bubble)
* **Legend:** Located on the bottom-left, defining the visual representation of relationships and entities.
* Orange Arrow: Super-Relation
* Light Blue Arrow: Filtered Super-Relation
* Light Green Circle: Entity
* Light Blue Circle: Filtered Entity
* **Example Super-Relations:** Located on the bottom-right, defining the color-coding for relation types.
* Yellow Triangle: Architecture.museum.director
* Red Circle: People.person
* Green Rectangle: Architecture.museum
* Blue Square: Business.employer
* **Entities:** Timothy Potts, J. Paul Getty Museum, Archaeologist, Fitzwilliam Museum, United Kingdom.
* **Reasoning Paths:** Text block stating "We gather the following Reasoning Paths".
* **Final Entities:** Fitzwilliam Museum, United Kingdom.
### Detailed Analysis or Content Details
The diagram shows the progression of reasoning through the knowledge graph.
**Step 1:**
* Timothy Potts (Entity, Light Green Circle) is connected to J. Paul Getty Museum (Entity, Light Green Circle) via a Super-Relation (Orange Arrow) with a score of 0.4.
* Timothy Potts is connected to Archaeologist (Entity, Light Green Circle) via a Super-Relation with a score of 0.1.
* Archaeologist is connected to J. Paul Getty Museum via a Super-Relation with a score of 0.2.
* Length 1 is indicated below this step.
**Step L:**
* Fitzwilliam Museum (Entity, Light Green Circle) is connected to United Kingdom (Entity, Light Green Circle) via a Super-Relation (Orange Arrow) with a score of 0.7.
* Fitzwilliam Museum is connected to an unnamed entity (Entity, Light Green Circle) via a Super-Relation with a score of 0.05.
* Length L is indicated below this step.
The connections between entities are represented by arrows with associated numerical scores (between 0 and 1). The arrows indicate the strength or relevance of the relationship. Filtered Super-Relations (Light Blue Arrows) are also present, but their specific connections are not clearly defined in the visible portion of the diagram.
### Key Observations
* The diagram demonstrates a process of iteratively refining relationships between entities to arrive at an answer.
* The scores associated with the relationships suggest varying degrees of confidence or relevance.
* The diagram highlights the importance of multiple reasoning steps (Step 1 to Step L) in complex knowledge graph queries.
* The final answer, "The Fitzwilliam Museum," is derived from the accumulated evidence gathered through the reasoning steps.
### Interpretation
The diagram illustrates a knowledge graph-based question answering system. The system begins with a natural language question and transforms it into a series of graph traversals. Each step refines the search by retrieving relevant relationships and scoring them based on their contribution to the answer. The Integrator component then synthesizes the information from all steps to provide a final answer. The use of scores suggests a probabilistic or weighted approach to reasoning, where stronger relationships contribute more to the final result. The diagram emphasizes the importance of representing knowledge as a graph and leveraging graph algorithms for complex reasoning tasks. The example super-relations provide a taxonomy of the types of relationships stored within the knowledge graph. The diagram does not provide any quantitative data about the performance of the system, but it visually conveys the underlying logic and flow of information.