\n
## Chart: Pursuit-Evasion Trajectories
### Overview
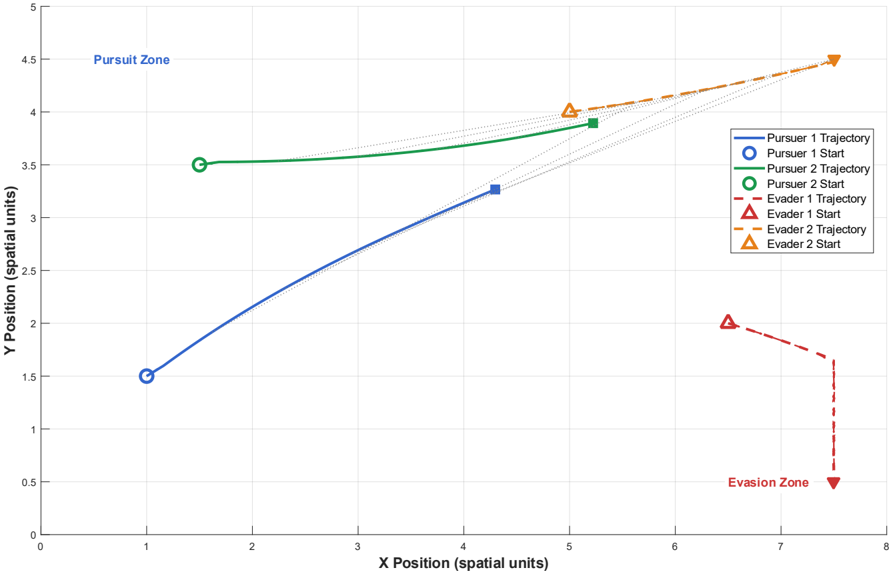
The image depicts a 2D plot showing the trajectories of two pursuers and two evaders in a pursuit-evasion scenario. The plot visualizes the X and Y positions of each entity over time, with distinct trajectories for each. The space is divided into a "Pursuit Zone" and an "Evasion Zone".
### Components/Axes
* **X-axis:** Labeled "X Position (spatial units)", ranging from 0 to 8.
* **Y-axis:** Labeled "Y Position (spatial units)", ranging from 0 to 5.
* **Legend:** Located in the top-right corner. Contains the following entries:
* Pursuer 1 Trajectory (Solid Black Line)
* Pursuer 1 Start (White Circle)
* Pursuer 2 Trajectory (Solid Blue Line)
* Pursuer 2 Start (Green Circle)
* Evader 1 Trajectory (Dashed Red Line)
* Evader 1 Start (Red Triangle)
* Evader 2 Trajectory (Dashed Orange Line)
* Evader 2 Start (Orange Triangle)
* **Zones:**
* "Pursuit Zone" - Top-left area of the plot.
* "Evasion Zone" - Bottom-right area of the plot.
### Detailed Analysis
Let's analyze each trajectory individually:
* **Pursuer 1:** Starts at approximately (1, 1.5). The trajectory is a straight line increasing in both X and Y, ending at approximately (4, 3.5).
* **Pursuer 2:** Starts at approximately (1, 3.5). The trajectory is a straight line increasing in both X and Y, ending at approximately (5, 4).
* **Evader 1:** Starts at approximately (7, 2). The trajectory is a dashed line decreasing in Y and increasing in X, ending at approximately (7.5, 1.8).
* **Evader 2:** Starts at approximately (5, 4). The trajectory is a dashed line decreasing in both X and Y, ending at approximately (7, 2.5).
**Data Points (Approximate):**
| Entity | Start X | Start Y | End X | End Y |
| ------------- | ------- | ------- | ----- | ----- |
| Pursuer 1 | 1 | 1.5 | 4 | 3.5 |
| Pursuer 2 | 1 | 3.5 | 5 | 4 |
| Evader 1 | 7 | 2 | 7.5 | 1.8 |
| Evader 2 | 5 | 4 | 7 | 2.5 |
### Key Observations
* Both pursuers are moving towards the upper-right quadrant of the plot.
* Both evaders are moving towards the lower-right quadrant of the plot.
* The pursuers start at similar X positions but different Y positions.
* The evaders start at different X and Y positions.
* The trajectories are relatively straight lines, suggesting constant velocity.
* The "Pursuit Zone" and "Evasion Zone" seem to define areas of initial engagement and escape, respectively.
### Interpretation
The chart illustrates a simplified pursuit-evasion scenario. The pursuers are attempting to intercept the evaders. The trajectories suggest that the evaders are attempting to move away from the pursuers, potentially towards the "Evasion Zone". The straight-line trajectories imply that the entities are moving at constant speeds and in fixed directions. The positioning of the "Pursuit Zone" and "Evasion Zone" suggests a strategic division of the space, where the pursuers begin their chase and the evaders attempt to reach safety. The fact that the pursuers start at the same X coordinate suggests a coordinated pursuit. The different starting Y coordinates could represent different initial strategies or response times. The evaders' trajectories suggest they are attempting to maximize distance from the pursuers, but their paths are not necessarily optimal for reaching the "Evasion Zone" quickly. Further analysis would require information about the velocities of each entity and the rules governing the pursuit-evasion dynamics.