\n
## Bar Chart: Fraction vs. Average Accuracy for Critical and Random Tokens
### Overview
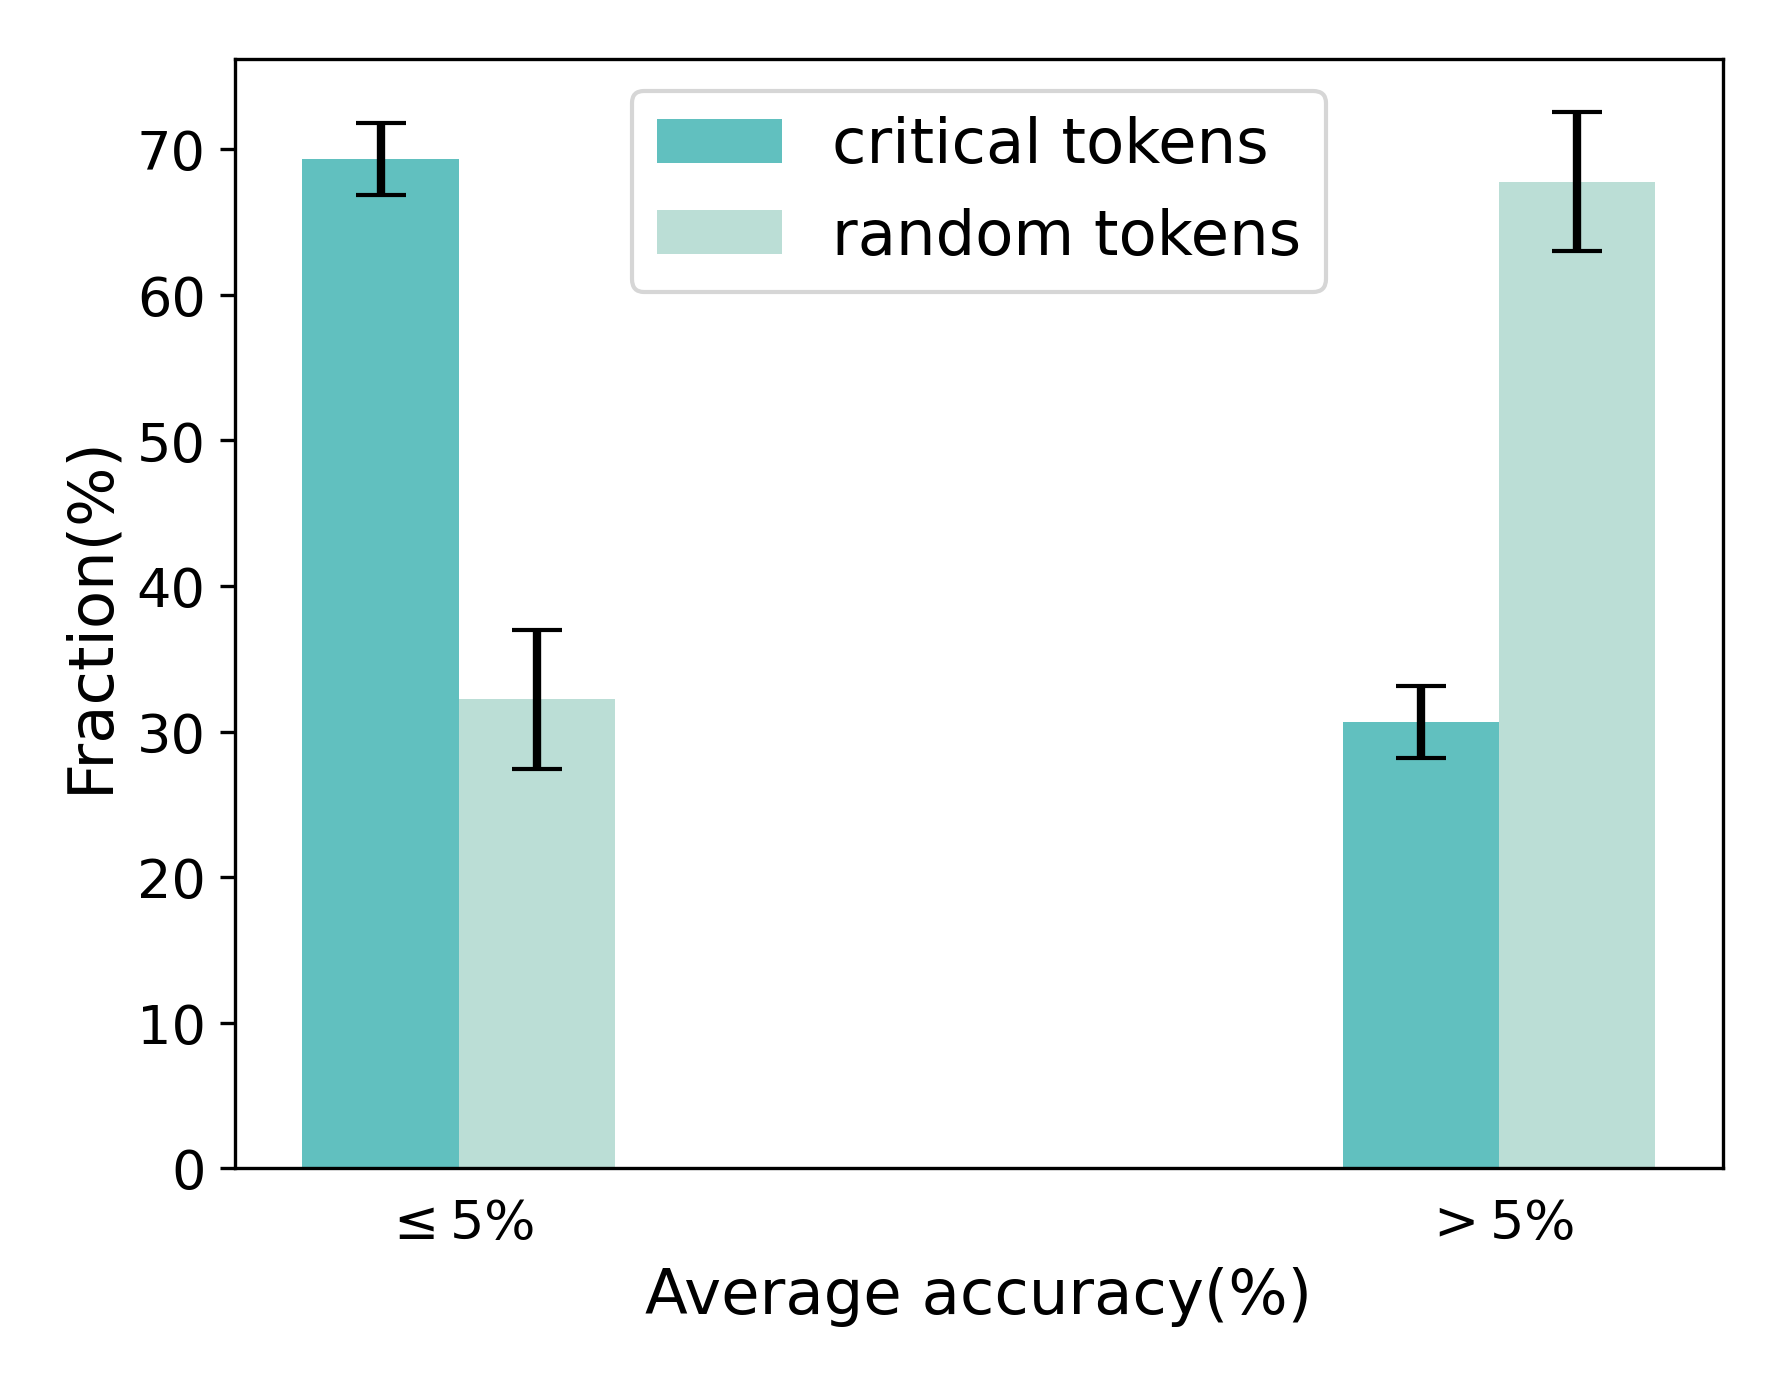
This bar chart compares the fraction of tokens (expressed as a percentage) for "critical tokens" and "random tokens" based on their average accuracy (also expressed as a percentage). The chart displays two groups of bars, one for tokens with average accuracy less than or equal to 5% and another for tokens with average accuracy greater than 5%. Error bars are included for each bar, indicating the variability or uncertainty in the fraction values.
### Components/Axes
* **X-axis:** "Average accuracy (%)" with two categories: "≤ 5%" and "> 5%".
* **Y-axis:** "Fraction (%)" ranging from 0 to 70.
* **Legend:** Located in the top-right corner, distinguishing between "critical tokens" (represented by a teal color) and "random tokens" (represented by a light grey color).
* **Bars:** Represent the fraction of tokens for each category and token type.
* **Error Bars:** Black lines extending vertically from the top of each bar, indicating the standard error or confidence interval.
### Detailed Analysis
The chart presents four bars with associated error bars.
**For Average Accuracy ≤ 5%:**
* **Critical Tokens:** The bar is teal and reaches approximately 68% on the Y-axis. The error bar extends from approximately 63% to 73%.
* **Random Tokens:** The bar is light grey and reaches approximately 32% on the Y-axis. The error bar extends from approximately 27% to 37%.
**For Average Accuracy > 5%:**
* **Critical Tokens:** The bar is teal and reaches approximately 30% on the Y-axis. The error bar extends from approximately 25% to 35%.
* **Random Tokens:** The bar is light grey and reaches approximately 66% on the Y-axis. The error bar extends from approximately 61% to 71%.
### Key Observations
* When average accuracy is ≤ 5%, critical tokens have a significantly higher fraction than random tokens.
* When average accuracy is > 5%, random tokens have a significantly higher fraction than critical tokens.
* The error bars suggest a reasonable degree of uncertainty in the fraction estimates, but the differences between critical and random tokens within each accuracy category appear substantial.
### Interpretation
The data suggests a strong inverse relationship between average accuracy and the fraction of critical versus random tokens. Tokens with low average accuracy (≤ 5%) are predominantly critical tokens, while tokens with high average accuracy (> 5%) are predominantly random tokens. This could indicate that critical tokens are more challenging to predict or classify accurately, perhaps due to their inherent complexity or importance in the context. The higher fraction of random tokens with higher accuracy suggests they are easier to predict or classify.
The chart implies that focusing on improving the accuracy of critical tokens might be a key area for improvement, as they currently exhibit lower accuracy compared to random tokens. The error bars indicate that these differences are likely statistically significant, but further analysis would be needed to confirm this. The data could be used to inform strategies for model training or data selection, prioritizing critical tokens to enhance overall performance.