## Bar Chart: Fraction of Critical vs. Random Tokens by Average Accuracy
### Overview
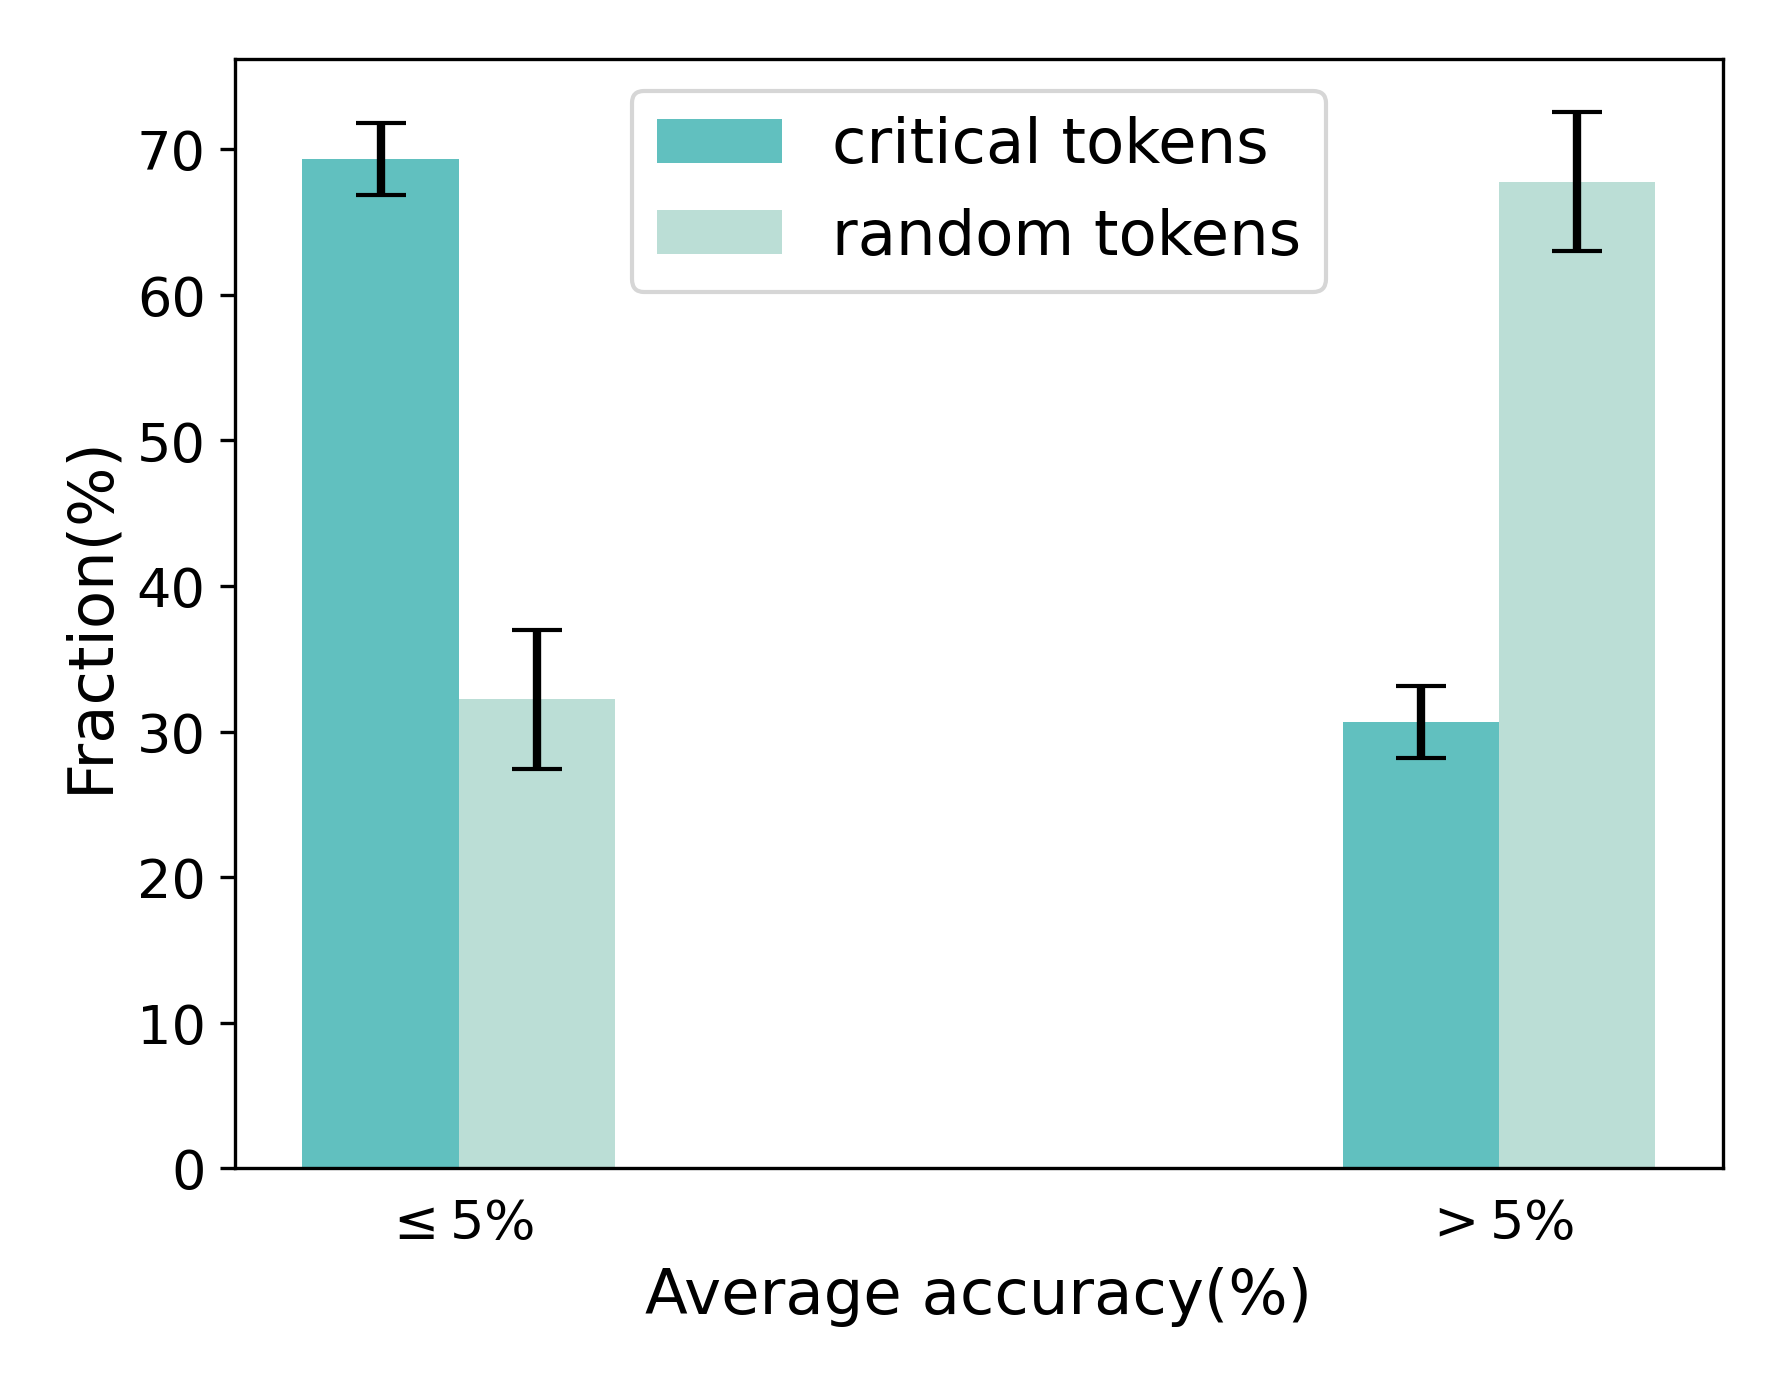
The chart compares the fraction of critical tokens and random tokens across two accuracy thresholds: ≤5% and >5%. Critical tokens (teal) dominate at lower accuracy, while random tokens (light teal) increase as accuracy rises above 5%.
### Components/Axes
- **X-axis**: "Average accuracy(%)" with two categories:
- ≤5% (left)
- >5% (right)
- **Y-axis**: "Fraction(%)" ranging from 0 to 70.
- **Legend**:
- Teal: Critical tokens
- Light teal: Random tokens
### Detailed Analysis
- **≤5% Accuracy**:
- Critical tokens: 70% (error bar: ±3%)
- Random tokens: 32% (error bar: ±4%)
- **>5% Accuracy**:
- Critical tokens: 31% (error bar: ±2%)
- Random tokens: 68% (error bar: ±3%)
### Key Observations
1. **Inverse Relationship**: Critical tokens decrease as accuracy increases, while random tokens increase.
2. **Error Bars**: Uncertainty is smallest for critical tokens at >5% accuracy (±2%) and largest for random tokens at ≤5% accuracy (±4%).
3. **Threshold Effect**: The >5% accuracy category shows a stark shift in token distribution compared to ≤5%.
### Interpretation
The data suggests that critical tokens are more prevalent in low-accuracy scenarios, potentially indicating their role in stabilizing or correcting model outputs. Conversely, random tokens dominate in high-accuracy cases, possibly reflecting less impactful or filler tokens. The sharp contrast between the two accuracy thresholds implies a binary behavior: critical tokens are prioritized when accuracy is poor, while random tokens proliferate when the model performs well. The error bars confirm moderate variability, but the trends are statistically significant.