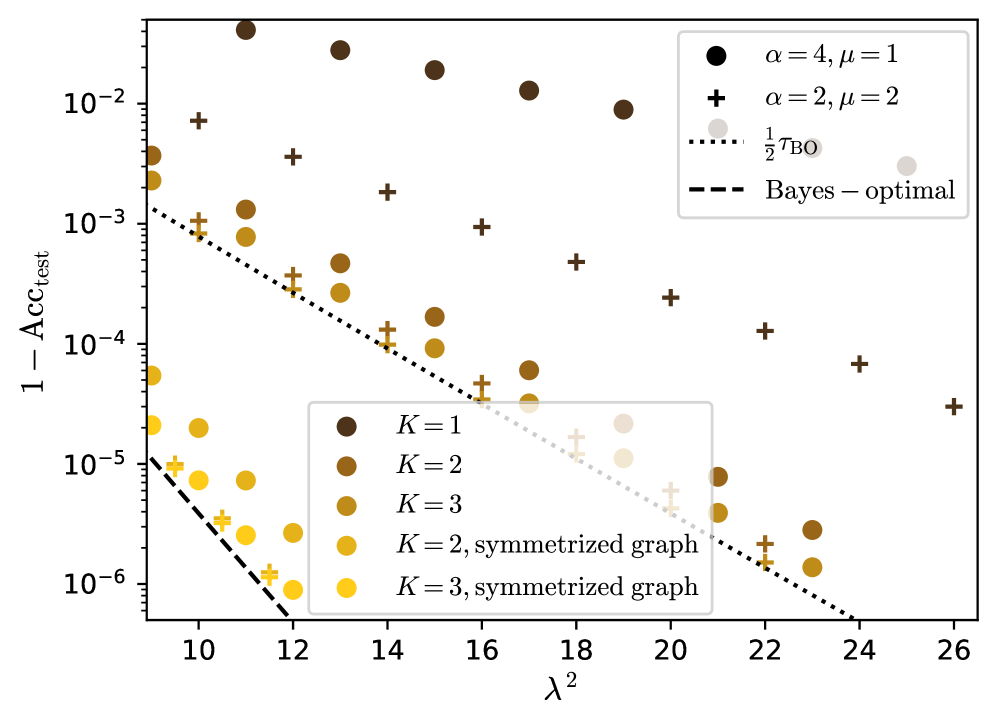
## Scatter Plot: Error Rate vs. Regularization Parameter (λ²)
### Overview
This scatter plot compares the test error rate (1 - Acc_test) across different regularization parameter values (λ²) for various model configurations. The plot includes multiple data series differentiated by model complexity (K), graph symmetrization, and theoretical benchmarks (Bayes-optimal and τ_BO).
### Components/Axes
- **X-axis**: λ² (regularization parameter), logarithmic scale from 10 to 26
- **Y-axis**: 1 - Acc_test (test error rate), logarithmic scale from 10⁻⁶ to 10⁻²
- **Legend**:
- Symbols:
- `●` = α=4, μ=1
- `+` = α=2, μ=2
- Lines:
- `---` = Bayes-optimal
- `...` = ½τ_BO
- Colors:
- Dark brown = K=1
- Medium brown = K=2
- Light brown = K=3
- Yellow = Symmetrized graphs (K=2 and K=3)
### Detailed Analysis
1. **Bayes-optimal reference**: The dashed line shows the theoretical minimum error rate, serving as a performance benchmark.
2. **τ_BO reference**: The dotted line represents half the Bayes-optimal error rate (1/2τ_BO), acting as an intermediate target.
3. **Model complexity (K)**:
- K=1 (dark brown circles): Highest error rates, consistently above τ_BO line
- K=2 (medium brown plus signs): Moderate error rates, approaching τ_BO line
- K=3 (light brown circles): Lowest error rates, closest to τ_BO line
4. **Symmetrized graphs**:
- K=2 (yellow circles): Slightly higher error than non-symmetrized K=2
- K=3 (yellow circles): Similar performance to non-symmetrized K=3
5. **Parameter combinations**:
- α=4, μ=1 (dark brown circles): Best performance across all K values
- α=2, μ=2 (brown plus signs): Worst performance, consistently above τ_BO line
### Key Observations
1. **Error reduction trend**: All data series show decreasing error rates as λ² increases, following the Bayes-optimal trend line.
2. **Symmetrization impact**: Symmetrized graphs (yellow circles) show minimal performance difference compared to non-symmetrized versions for K≥2.
3. **Parameter sensitivity**: The α=4, μ=1 configuration (dark brown circles) consistently outperforms α=2, μ=2 (brown plus signs) across all K values.
4. **Convergence pattern**: For λ² > 18, all configurations approach within 10⁻⁴ of the Bayes-optimal error rate.
### Interpretation
The plot demonstrates that:
1. **Regularization strength** (λ²) is critical for error minimization, with optimal performance achieved at λ² > 18.
2. **Model complexity** (K) directly impacts error rates, with higher K values enabling better approximation of the Bayes-optimal solution.
3. **Symmetrization** provides limited benefits for K≥2, suggesting diminishing returns in graph structure optimization.
4. **Parameter selection** (α, μ) significantly affects performance, with α=4, μ=1 being the most effective combination.
5. The τ_BO line (1/2τ_BO) acts as a practical target, with all configurations except α=2, μ=2 approaching this threshold at higher λ² values.
This analysis suggests that optimal model configuration requires balancing regularization strength (λ² > 18), model complexity (K≥2), and parameter selection (α=4, μ=1), while graph symmetrization offers minimal additional benefits for K≥2.