\n
## Line Chart: Effect of Time Step (CIM-CAC)
### Overview
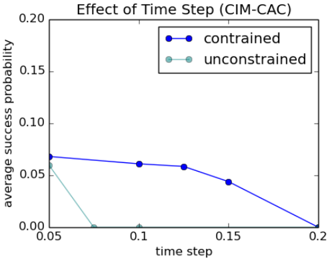
This image presents a line chart illustrating the effect of the time step on the average success probability for two scenarios: a constrained system and an unconstrained system. The chart displays how the average success probability changes as the time step varies from approximately 0.05 to 0.2.
### Components/Axes
* **Title:** "Effect of Time Step (CIM-CAC)" - positioned at the top-center of the chart.
* **X-axis:** "time step" - ranging from approximately 0.05 to 0.2, with markers at 0.05, 0.1, 0.15, and 0.2.
* **Y-axis:** "average success probability" - ranging from 0.0 to 0.2, with markers at 0.0, 0.05, 0.1, 0.15, and 0.2.
* **Legend:** Located at the top-right corner of the chart.
* "constrained" - represented by a solid blue line with circular markers.
* "unconstrained" - represented by a dashed light-blue line with circular markers.
### Detailed Analysis
**Constrained Line (Blue):**
The constrained line starts at approximately 0.075 at a time step of 0.05. It then decreases gradually to approximately 0.06 at a time step of 0.1, then to approximately 0.045 at a time step of 0.15, and finally reaches approximately 0.0 at a time step of 0.2. The line exhibits a downward trend, indicating a decreasing success probability as the time step increases.
**Unconstrained Line (Light-Blue):**
The unconstrained line begins at approximately 0.055 at a time step of 0.05. It then decreases sharply to approximately 0.0 at a time step of 0.1, and remains at approximately 0.0 for the remaining time steps (0.15 and 0.2). This line shows a rapid decline in success probability with increasing time step.
### Key Observations
* The constrained system initially has a higher success probability than the unconstrained system.
* The success probability for the constrained system decreases gradually with increasing time step.
* The success probability for the unconstrained system drops to zero very quickly as the time step increases.
* The unconstrained system is significantly more sensitive to changes in the time step than the constrained system.
### Interpretation
The chart suggests that increasing the time step negatively impacts the average success probability for both constrained and unconstrained systems. However, the unconstrained system is far more susceptible to this effect. This could indicate that the constraints in the constrained system provide stability and robustness against larger time steps. The rapid decline in success probability for the unconstrained system suggests that it may be more prone to instability or errors when using larger time steps. The data implies that for optimal performance, a smaller time step should be used, particularly for unconstrained systems. The CIM-CAC context suggests this relates to a control or simulation environment where time step selection is critical for accurate results. The fact that the constrained system maintains *some* success probability even at the largest time step suggests the constraints are effectively mitigating the negative effects of a larger time step.