\n
## Line Chart: Pretrain (Warmup) Loss Curves
### Overview
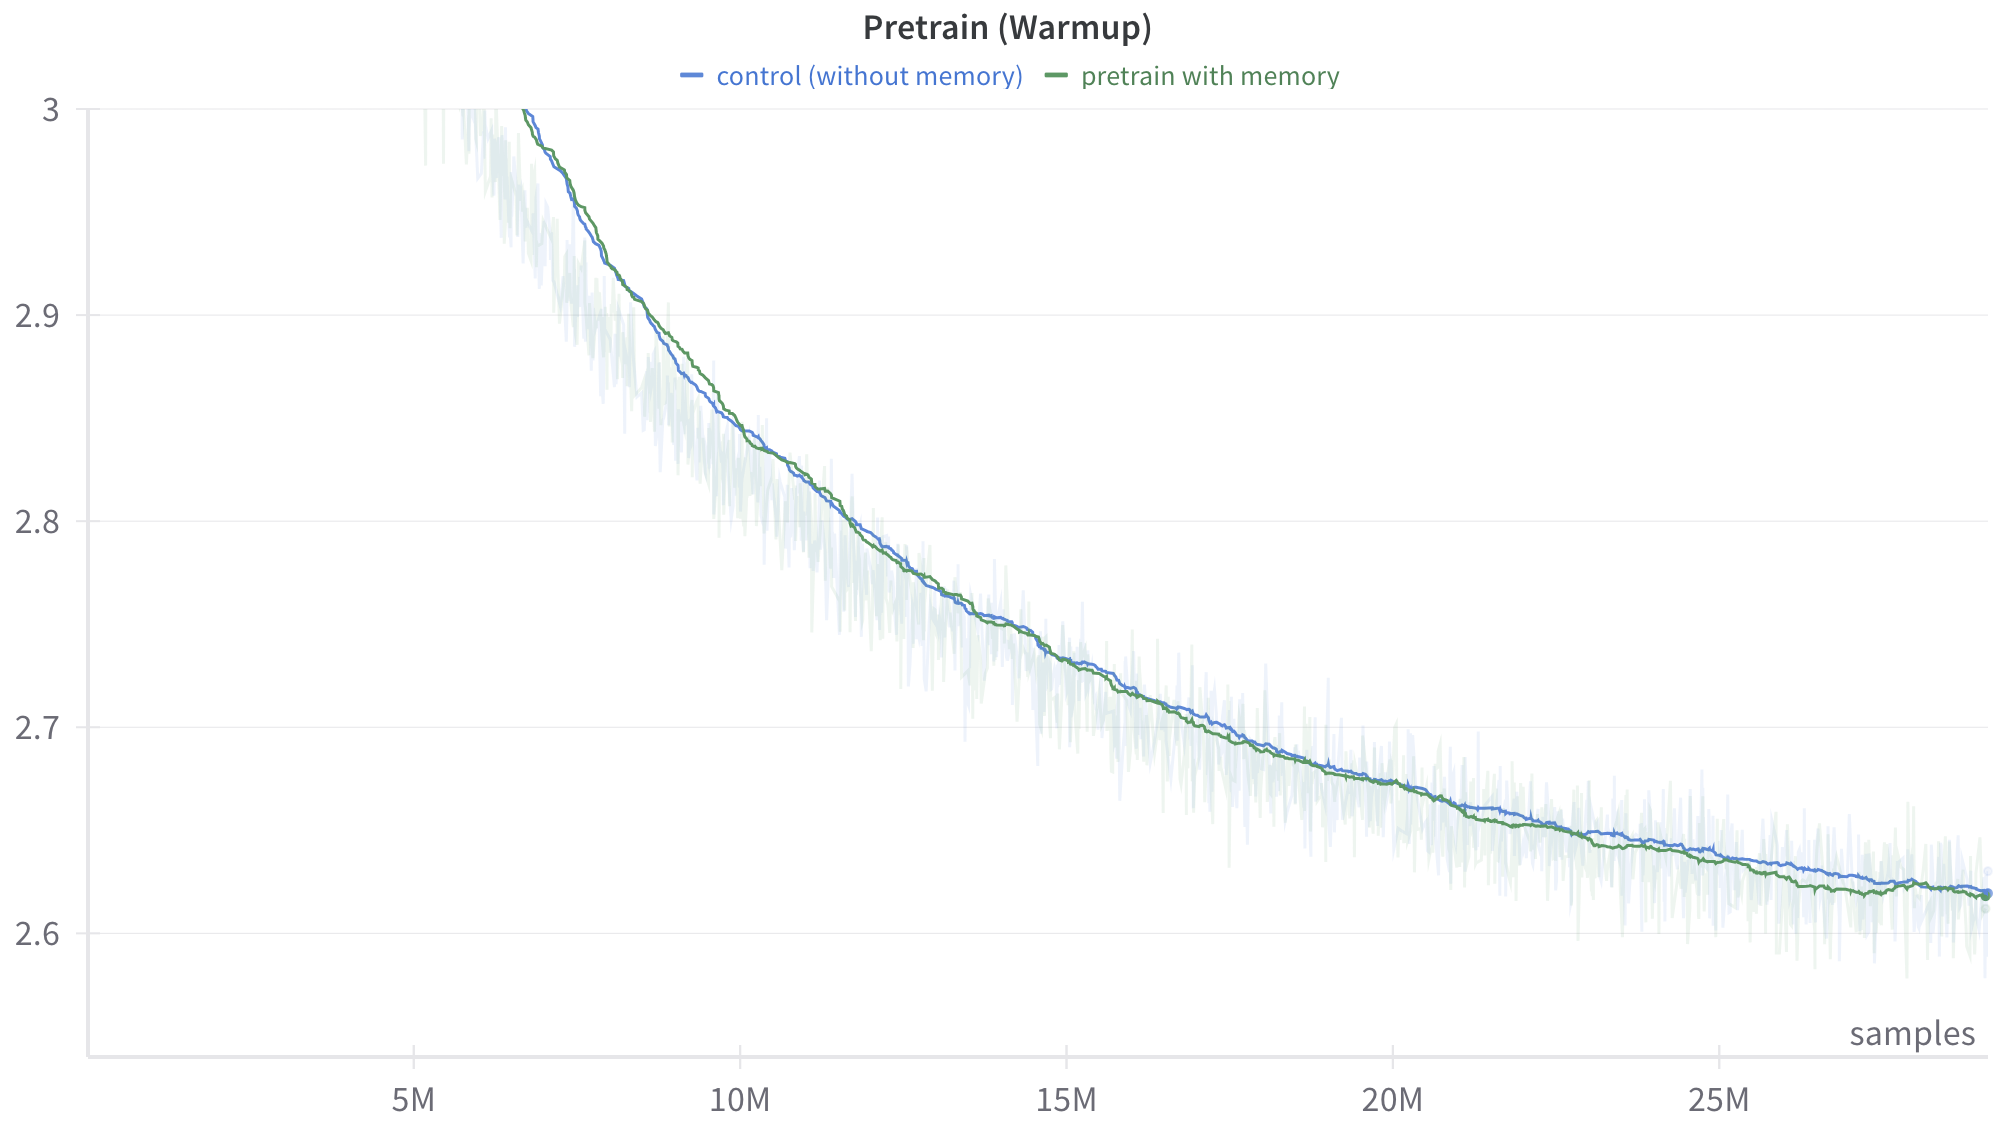
The image displays a line chart comparing the training loss (y-axis) over the number of training samples (x-axis) for two different pretraining configurations during a "warmup" phase. The chart shows a clear downward trend for both configurations, indicating that the model's performance (as measured by loss) improves with more training data.
### Components/Axes
* **Chart Title:** "Pretrain (Warmup)"
* **X-Axis:**
* **Label:** "samples"
* **Scale:** Linear scale with major tick marks at 5M, 10M, 15M, 20M, and 25M (where "M" denotes millions).
* **Y-Axis:**
* **Label:** Not explicitly labeled. Based on context, it represents a loss metric (e.g., cross-entropy loss).
* **Scale:** Linear scale with major tick marks at 2.6, 2.7, 2.8, 2.9, and 3.0.
* **Legend:** Located at the top center of the chart.
* **Blue Line:** "control (without memory)"
* **Green Line:** "pretrain with memory"
* **Data Series:** Two primary lines with associated shaded regions.
* **Blue Line (Control):** Represents the training loss for the baseline model without a memory component.
* **Green Line (With Memory):** Represents the training loss for the model incorporating a memory mechanism.
* **Shaded Regions:** Light blue and light green shaded areas around their respective lines, likely indicating variance, standard deviation, or a confidence interval across multiple runs.
### Detailed Analysis
**Trend Verification:**
* **Control (Blue Line):** The line exhibits a steep downward slope from the start (left) until approximately 10M samples, after which the rate of decrease slows, forming a convex curve that gradually flattens.
* **Pretrain with Memory (Green Line):** Follows a nearly identical trajectory to the control line. It also shows a steep initial decline followed by a gradual flattening.
**Data Point Extraction (Approximate Values):**
* **At ~5M samples:**
* Control (Blue): Loss ≈ 3.0
* With Memory (Green): Loss ≈ 2.99 (slightly below the blue line)
* **At 10M samples:**
* Control (Blue): Loss ≈ 2.85
* With Memory (Green): Loss ≈ 2.84
* **At 15M samples:**
* Control (Blue): Loss ≈ 2.73
* With Memory (Green): Loss ≈ 2.72
* **At 20M samples:**
* Control (Blue): Loss ≈ 2.67
* With Memory (Green): Loss ≈ 2.66
* **At 25M samples (end of chart):**
* Control (Blue): Loss ≈ 2.62
* With Memory (Green): Loss ≈ 2.62 (The lines appear to converge at this point).
**Spatial Grounding & Comparison:**
The green line ("with memory") is consistently positioned slightly below the blue line ("control") throughout the entire visible range from 5M to 25M samples. The vertical gap between them is very small but persistent. The shaded variance regions for both lines overlap significantly, suggesting the difference in mean loss may not be statistically large relative to the run-to-run variability.
### Key Observations
1. **Dominant Trend:** Both configurations show a strong, monotonic decrease in loss as training samples increase, which is the expected behavior for a successful training process.
2. **Diminishing Returns:** The rate of loss improvement slows dramatically after the first 10M samples. The curve from 10M to 25M samples is much flatter than from 5M to 10M.
3. **Minimal Performance Gap:** The "pretrain with memory" configuration maintains a very slight but consistent advantage (lower loss) over the "control" configuration across the entire warmup phase shown.
4. **Convergence:** By 25M samples, the two lines are nearly indistinguishable, suggesting the performance benefit of memory may diminish or stabilize with sufficient training data in this warmup phase.
5. **High Variance:** The wide shaded regions indicate substantial noise or variability in the loss measurement at each point, which is common in early training stages.
### Interpretation
This chart demonstrates the efficacy of the pretraining process, as loss decreases with more data. The core finding is that **incorporating a memory mechanism provides a marginal but consistent improvement in training efficiency (lower loss) during the warmup phase** compared to a control model without memory.
The data suggests the memory component helps the model learn slightly faster or more effectively from the same amount of data, particularly in the earlier stages (5M-15M samples). However, the benefit is small in magnitude. The convergence of the lines at 25M samples could imply that:
* The memory's advantage is most critical early on.
* Given enough data, the control model eventually catches up in performance for this specific metric and phase.
* The warmup phase's objectives might be largely met by both models after 25M samples, setting the stage for subsequent training phases.
The high variance (shaded areas) is a critical context; the observed difference between the two methods, while consistent, is small relative to the noise. A rigorous analysis would require statistical testing to confirm if the gap is significant. Overall, the chart supports the hypothesis that memory-augmented pretraining is beneficial, but the effect size during warmup appears to be modest.