# Technical Data Extraction: Control Effect Analysis
This document provides a detailed extraction of the data and trends presented in the provided image, which consists of two line graphs labeled **a** and **b**.
## 1. General Metadata
* **Language:** English
* **Image Type:** Scientific line charts with error bands (shaded regions representing confidence intervals or standard deviation).
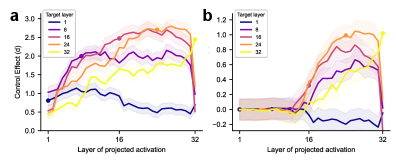
* **Common X-Axis:** "Layer of projected activation"
* **Range:** 1 to 32.
* **Major Markers:** 1, 16, 32.
* **Common Legend:** "Target layer" (located in the top-left quadrant of both charts).
* **Series 1 (Dark Blue):** Layer 1
* **Series 2 (Purple):** Layer 8
* **Series 3 (Magenta):** Layer 16
* **Series 4 (Orange):** Layer 24
* **Series 5 (Yellow):** Layer 32
* **Visual Indicators:** Each series has a single circular marker (dot) placed at the x-coordinate corresponding to its "Target layer" value (e.g., the yellow line has a dot at x=32).
---
## 2. Chart Analysis: Panel (a)
### Axis Information
* **Y-Axis Title:** Control Effect (d)
* **Y-Axis Range:** 0.0 to 3.0 (increments of 0.5).
### Data Series Trends and Key Points
| Series (Target Layer) | Color | Visual Trend Description | Peak Value (Approx) | Value at x=32 |
| :--- | :--- | :--- | :--- | :--- |
| **1** | Dark Blue | Starts at ~0.8, peaks early (~1.1 at x=8), then steadily declines. | 1.1 | ~0.5 |
| **8** | Purple | Sharp rise from x=1 to x=8, plateaus/fluctuates between 1.8 and 2.2. | 2.2 | ~0.6 |
| **16** | Magenta | Steady rise, peaks at the target layer (x=16) at ~2.5, then declines. | 2.5 | ~0.7 |
| **24** | Orange | Gradual rise, peaks at the target layer (x=24) at ~2.7, then sharp drop. | 2.7 | ~0.8 |
| **32** | Yellow | Lowest starting point, steady upward slope throughout, peaks at x=32. | 2.4 | 2.4 |
---
## 3. Chart Analysis: Panel (b)
### Axis Information
* **Y-Axis Title:** Control Effect (d)
* **Y-Axis Range:** -0.2 to 1.2 (increments of 0.2).
### Data Series Trends and Key Points
In this panel, all series remain near zero until approximately x=14, after which they diverge significantly.
| Series (Target Layer) | Color | Visual Trend Description | Peak Value (Approx) | Value at x=32 |
| :--- | :--- | :--- | :--- | :--- |
| **1** | Dark Blue | Flat at 0 until x=14, then drops into negative values. | 0.0 | -0.1 |
| **8** | Purple | Flat until x=14, rises to a peak of ~0.6 at x=24, then drops. | 0.65 | ~0.0 |
| **16** | Magenta | Flat until x=14, rises sharply to peak at ~0.85 at x=24, then drops. | 0.85 | ~0.0 |
| **24** | Orange | Flat until x=14, highest rise, peaks at target layer (x=24) at ~1.0. | 1.0 | ~0.0 |
| **32** | Yellow | Flat until x=16, steady rise starting later than others, peaks at x=32. | 1.0 | 1.0 |
---
## 4. Component Isolation & Summary
### Header/Labels
* **Panel a:** Represents a baseline or primary measurement of Control Effect across all layers.
* **Panel b:** Represents a measurement where effects are suppressed or "zeroed out" for the first half of the layers (1-14), showing that the control effect is localized to later stages of the model.
### Spatial Grounding Verification
* **Legend Placement:** Top-Left in both panels.
* **Color Consistency:** The colors used for the lines (Dark Blue, Purple, Magenta, Orange, Yellow) map consistently to the Target Layers (1, 8, 16, 24, 32) across both charts.
* **Target Markers:** In both charts, a dot is placed on the line where the "Layer of projected activation" (X) equals the "Target layer" (Legend). For example, in Panel B, the Orange line has a dot at X=24, Y=1.0.