## Line Graph: Training Metrics Over Steps
### Overview
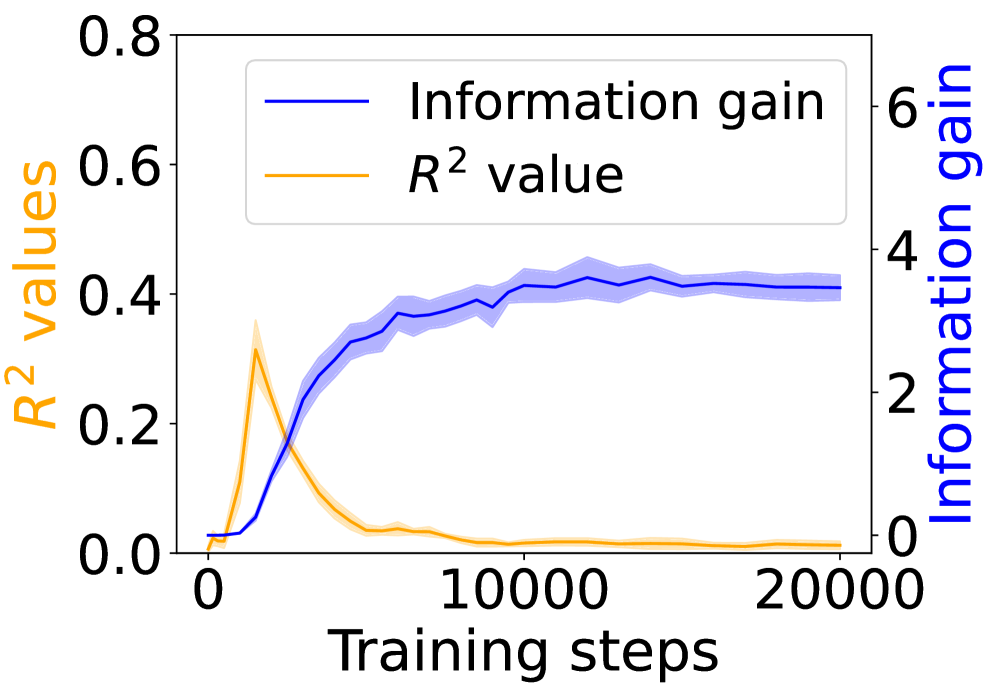
The image depicts a line graph comparing two metrics—**Information gain** and **R² values**—across **20,000 training steps**. The graph includes two y-axes: the left axis (orange) for R² values (0–0.8) and the right axis (blue) for Information gain (0–6). A legend in the top-left corner distinguishes the two metrics by color.
---
### Components/Axes
- **X-axis**: Training steps (0 to 20,000, linear scale).
- **Left Y-axis (Orange)**: R² values (0 to 0.8).
- **Right Y-axis (Blue)**: Information gain (0 to 6).
- **Legend**:
- Blue line: Information gain.
- Orange line: R² value.
- **Shading**: Light blue and orange bands around the lines suggest confidence intervals or variability.
---
### Detailed Analysis
1. **R² Value (Orange Line)**:
- Starts at ~0.6 at step 0.
- Peaks sharply at ~0.75 around step 5,000.
- Declines steeply to ~0.05 by step 10,000.
- Remains near 0.05 until step 20,000.
2. **Information Gain (Blue Line)**:
- Starts at 0 at step 0.
- Increases monotonically, reaching ~4 by step 15,000.
- Plateaus at ~4 from step 15,000 to 20,000.
---
### Key Observations
- **Inverse Relationship Early On**: R² values drop sharply as Information gain rises (steps 0–10,000).
- **Divergence Post-10,000 Steps**: R² stabilizes near 0.05 while Information gain plateaus at ~4.
- **Peak Discrepancy**: R² peaks at step 5,000, while Information gain peaks at step 15,000.
---
### Interpretation
- **Early Training (Steps 0–5,000)**: High R² suggests the model initially fits the data well, but Information gain remains low, indicating limited feature relevance.
- **Mid-Training (Steps 5,000–15,000)**: R² plummets, likely due to overfitting or model complexity, while Information gain surges, implying the model begins capturing meaningful patterns.
- **Late Training (Steps 15,000–20,000)**: Both metrics stabilize. The low R² suggests poor generalization, but sustained Information gain implies the model retains useful feature relationships despite poor fit.
- **Anomaly**: The sharp R² drop after step 5,000 contrasts with the gradual Information gain rise, hinting at a potential trade-off between model fit and feature utility.
---
### Spatial Grounding
- **Legend**: Top-left corner, clearly associating colors with metrics.
- **Secondary Y-axis**: Right side, ensuring dual-scale clarity.
- **Line Placement**: Blue (Information gain) dominates the upper half; orange (R²) occupies the lower half.
---
### Content Details
- **R² Values**:
- Step 0: ~0.6
- Step 5,000: ~0.75 (peak)
- Step 10,000: ~0.05
- Step 20,000: ~0.05
- **Information Gain**:
- Step 0: 0
- Step 15,000: ~4 (peak)
- Step 20,000: ~4
---
### Key Observations (Reiterated)
- The graph highlights a critical phase shift in model behavior around step 5,000, where R² and Information gain diverge sharply.
- The late-stage plateau in Information gain suggests diminishing returns in feature relevance despite continued training.
---
### Interpretation (Expanded)
- **Model Behavior**: The divergence between R² and Information gain implies that early training prioritizes data fit (high R²) over meaningful feature extraction (low Information gain). Later, the model shifts focus to capturing feature relationships (high Information gain) at the cost of generalization (low R²).
- **Practical Implications**: This pattern may indicate a need for regularization or early stopping to balance fit and feature utility. The late-stage stability suggests the model has exhausted its capacity to learn new patterns.