## Line Charts: Performance Comparison of Base Models vs. Apollo-Augmented Models
### Overview
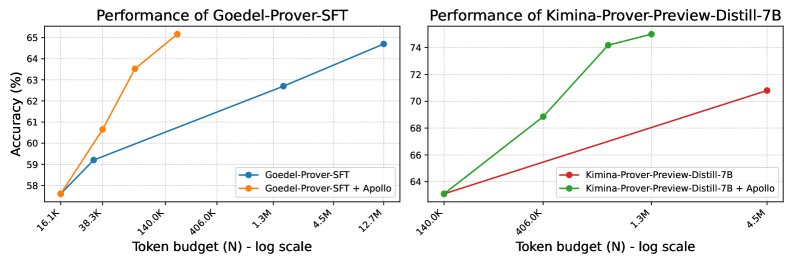
The image consists of two side-by-side line charts demonstrating the performance (Accuracy) of two different language models ("Goedel-Prover-SFT" and "Kimina-Prover-Preview-Distill-7B") as a function of their token budget. Each chart compares the base model against a version augmented with a system or method called "Apollo". The language used in the image is entirely English.
---
### Component Isolation: Left Chart (Goedel-Prover-SFT)
#### Components/Axes
* **Positioning:** Left half of the image.
* **Title:** "Performance of Goedel-Prover-SFT" (Centered at the top).
* **Y-Axis:**
* **Label:** "Accuracy (%)" (Rotated 90 degrees, positioned on the far left).
* **Scale:** Linear, ranging from 58 to 65.
* **Markers/Gridlines:** Horizontal dotted gridlines at integer intervals: 58, 59, 60, 61, 62, 63, 64, 65.
* **X-Axis:**
* **Label:** "Token budget (N) - log scale" (Centered at the bottom).
* **Scale:** Logarithmic.
* **Markers:** Tilted text labels at specific intervals: 16.1K, 38.3K, 140.0K, 406.0K, 1.3M, 4.5M, 12.7M. Vertical dotted gridlines align with these markers.
* **Legend:** Positioned in the bottom-right corner of the chart area, enclosed in a white box with a light gray border.
* Blue line with a solid circle marker: `Goedel-Prover-SFT`
* Orange line with a solid circle marker: `Goedel-Prover-SFT + Apollo`
#### Detailed Analysis (Left Chart)
* **Trend Verification - Blue Line (Goedel-Prover-SFT):** The blue line exhibits a steady, moderate upward slope across the entire visible x-axis, indicating a gradual increase in accuracy as the token budget increases.
* Point 1: X = 16.1K, Y ≈ 57.6%
* Point 2: X = 38.3K, Y ≈ 59.2%
* Point 3: X = 1.3M, Y ≈ 62.7%
* Point 4: X = 12.7M, Y ≈ 64.7%
* **Trend Verification - Orange Line (Goedel-Prover-SFT + Apollo):** The orange line starts at the exact same point as the blue line but slopes upward much more steeply. It achieves higher accuracy at significantly lower token budgets and terminates earlier on the x-axis.
* Point 1: X = 16.1K, Y ≈ 57.6% (Shared origin with the blue line)
* Point 2: X = 38.3K, Y ≈ 60.7%
* Point 3: X = 140.0K, Y ≈ 63.5%
* Point 4: X ≈ 300K (Visually positioned before the 406.0K marker), Y ≈ 65.2%
---
### Component Isolation: Right Chart (Kimina-Prover-Preview-Distill-7B)
#### Components/Axes
* **Positioning:** Right half of the image.
* **Title:** "Performance of Kimina-Prover-Preview-Distill-7B" (Centered at the top).
* **Y-Axis:**
* **Label:** None explicitly written, but contextually inherits "Accuracy (%)" from the left chart.
* **Scale:** Linear, ranging from 64 to 74.
* **Markers/Gridlines:** Horizontal dotted gridlines at even integer intervals: 64, 66, 68, 70, 72, 74.
* **X-Axis:**
* **Label:** "Token budget (N) - log scale" (Centered at the bottom).
* **Scale:** Logarithmic.
* **Markers:** Tilted text labels at specific intervals: 140.0K, 406.0K, 1.3M, 4.5M. Vertical dotted gridlines align with these markers.
* **Legend:** Positioned in the bottom-right corner of the chart area, enclosed in a white box with a light gray border.
* Red line with a solid circle marker: `Kimina-Prover-Preview-Distill-7B`
* Green line with a solid circle marker: `Kimina-Prover-Preview-Distill-7B + Apollo`
#### Detailed Analysis (Right Chart)
* **Trend Verification - Red Line (Kimina-Prover-Preview-Distill-7B):** The red line shows a steady, moderate upward slope from the lowest visible token budget to the highest.
* Point 1: X = 140.0K, Y ≈ 63.1%
* Point 2: X = 4.5M, Y ≈ 70.8%
* **Trend Verification - Green Line (Kimina-Prover-Preview-Distill-7B + Apollo):** The green line shares the starting point with the red line but slopes upward sharply, achieving significantly higher accuracy at lower token budgets before the slope begins to shallow out slightly at the top.
* Point 1: X = 140.0K, Y ≈ 63.1% (Shared origin with the red line)
* Point 2: X = 406.0K, Y ≈ 68.8%
* Point 3: X ≈ 800K (Visually positioned roughly halfway between 406.0K and 1.3M on the log scale), Y ≈ 74.2%
* Point 4: X ≈ 1.5M (Visually positioned slightly to the right of the 1.3M marker), Y ≈ 75.0%
---
### Key Observations
1. **Shared Origins:** In both charts, the base model and the "+ Apollo" model start at the exact same accuracy for the lowest tested token budget (16.1K for Goedel, 140.0K for Kimina).
2. **Steeper Trajectories:** In both charts, the addition of "Apollo" (Orange line left, Green line right) results in a drastically steeper performance curve compared to the base models (Blue line left, Red line right).
3. **Different Baselines:** The Kimina model (Right Chart) operates at a higher overall accuracy baseline (ranging roughly 63% to 75%) compared to the Goedel model (Left Chart, ranging roughly 57% to 65%).
4. **Token Budget Ranges:** The Goedel chart evaluates performance starting from a much lower token budget (16.1K) and extending to a higher one (12.7M) compared to the Kimina chart (140.0K to 4.5M).
### Interpretation
The data strongly suggests that the "Apollo" augmentation is a highly effective method for improving the sample efficiency of these language models.
By reading between the lines, the charts demonstrate that to achieve a specific target accuracy, a model using Apollo requires orders of magnitude fewer tokens than the base model. For example, in the left chart, the base Goedel model requires roughly 12.7M tokens to reach ~64.7% accuracy. The Apollo-augmented version surpasses that accuracy (reaching ~65.2%) using fewer than 406K tokens.
This implies that Apollo significantly accelerates the learning or reasoning process during training or inference (depending on what "Token budget" specifically refers to in this context, though "Prover" suggests inference/search budgets in formal mathematics or logic tasks). The fact that this pattern holds true across two distinctly different models (Goedel and Kimina) indicates that Apollo is likely a generalized architectural improvement or search strategy rather than a model-specific tweak.