## Bar Chart: Latency vs. Batch Size for FP16 and INT8
### Overview
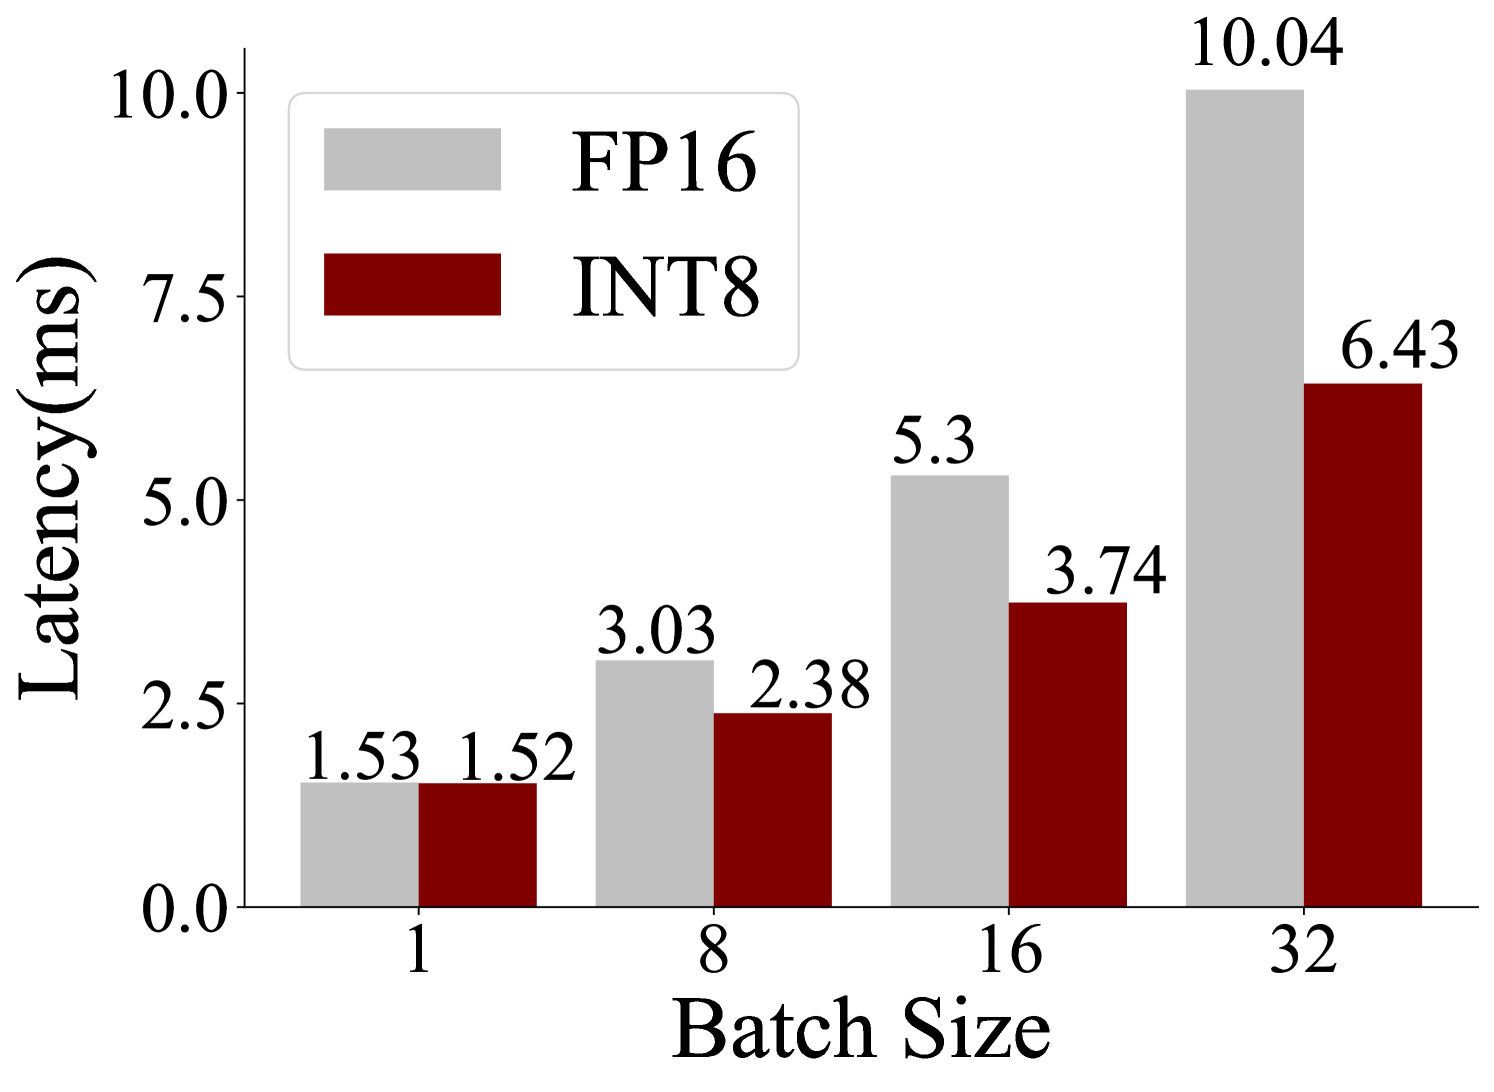
This image is a bar chart that visualizes the latency (in milliseconds) for two different data types, FP16 and INT8, across varying batch sizes. The chart shows how latency changes as the batch size increases from 1 to 32.
### Components/Axes
* **Y-axis Title**: "Latency(ms)"
* **Scale**: Linear, ranging from 0.0 to 10.0, with major tick marks at 0.0, 2.5, 5.0, 7.5, and 10.0.
* **X-axis Title**: "Batch Size"
* **Categories**: The x-axis displays discrete batch sizes: 1, 8, 16, and 32.
* **Legend**: Located in the top-left quadrant of the chart.
* **FP16**: Represented by a light gray rectangle.
* **INT8**: Represented by a dark red rectangle.
### Detailed Analysis
The chart displays paired bars for each batch size, with the light gray bar representing FP16 latency and the dark red bar representing INT8 latency.
**Batch Size 1:**
* FP16 (light gray bar): 1.53 ms
* INT8 (dark red bar): 1.52 ms
**Batch Size 8:**
* FP16 (light gray bar): 3.03 ms
* INT8 (dark red bar): 2.38 ms
**Batch Size 16:**
* FP16 (light gray bar): 5.3 ms
* INT8 (dark red bar): 3.74 ms
**Batch Size 32:**
* FP16 (light gray bar): 10.04 ms
* INT8 (dark red bar): 6.43 ms
### Key Observations
* **General Trend**: For both FP16 and INT8, latency generally increases as the batch size increases.
* **FP16 Trend**: The latency for FP16 shows a significant upward trend, particularly between batch sizes 16 and 32.
* **INT8 Trend**: The latency for INT8 also increases with batch size, but at a slower rate compared to FP16, especially at larger batch sizes.
* **Comparison**: At batch size 1, the latencies for FP16 and INT8 are very close. However, as the batch size increases, INT8 consistently shows lower latency than FP16. The difference in latency becomes more pronounced at larger batch sizes (16 and 32).
### Interpretation
This bar chart demonstrates the performance characteristics of FP16 and INT8 data types in terms of latency under varying computational loads (batch sizes).
* **Data Suggests**: The data suggests that INT8 is generally more efficient in terms of latency than FP16, especially as the batch size grows. This is likely due to the reduced precision of INT8 requiring less computational resources and memory bandwidth.
* **Relationship**: The x-axis (Batch Size) is the independent variable, and the y-axis (Latency) is the dependent variable. The legend differentiates the two data types (FP16 and INT8) whose latencies are being measured.
* **Notable Trends/Anomalies**:
* The most striking trend is the superior performance of INT8 at larger batch sizes. While FP16 latency nearly doubles from batch size 16 to 32 (from 5.3 ms to 10.04 ms), INT8 latency increases by a smaller margin (from 3.74 ms to 6.43 ms).
* At batch size 1, the latencies are almost identical, indicating that for very small workloads, the overhead of data type conversion or other factors might dominate, making the precision difference less impactful.
* The steep increase in FP16 latency at larger batch sizes could indicate memory bandwidth limitations or increased computational complexity that scales poorly with batch size for higher precision data. Conversely, INT8 appears to scale more favorably.
In essence, the chart highlights a common trade-off in deep learning and other computational tasks: using lower precision data types like INT8 can lead to significant performance gains (lower latency) with a potentially acceptable loss in accuracy, especially for inference tasks. FP16, while offering higher precision, incurs a higher latency cost as the workload increases.